Top 80 System Design
interview questions
Scalability, caching, sharding, consistency and real-world designs. Open a question to read the answer.
01Explain URL shortener at scale in the context of System Design.
A URL shortener maps a long URL to a short, unique key and redirects anyone who requests the key. The design is dominated by two asymmetries: reads vastly outnumber writes (often 100:1 or more), and the dataset is tiny per record but huge in count.
Core decisions:
- Key generation. Either hash the long URL (MD5/SHA-256, take the first 7 characters, resolve collisions by appending a salt) or hand out keys from a pre-generated pool or a distributed counter encoded in base62. Seven base62 characters give 62^7 ≈ 3.5 trillion keys, enough for decades at thousands of writes per second.
- Storage. A key-value store keyed by the short code; the record holds the long URL, owner, creation time and expiry. Partition by key, since lookups are always by key.
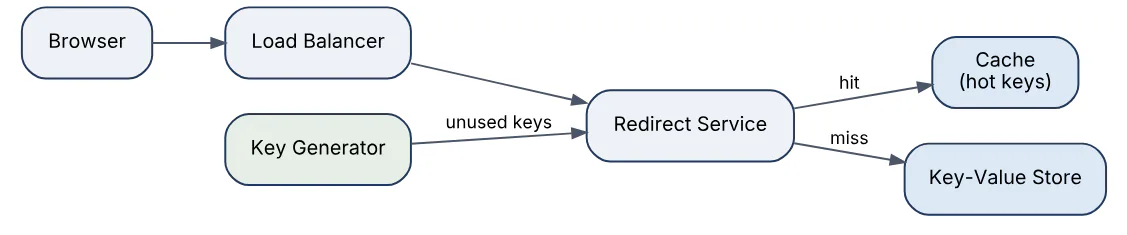
- Redirect path.
GET /abc123→ cache lookup → database fallback →301or302. A302keeps analytics accurate because browsers do not cache it permanently. - Caching. A small fraction of links receive most traffic, so an LRU cache in front of the store absorbs the majority of reads.
The diagram shows the read path with the cache absorbing hot keys.
Back-of-envelope: 100 million new URLs per month is roughly 40 writes/s and, at 100:1, about 4,000 reads/s; at 500 bytes per record, five years of data is around 3 TB, comfortably within a single partitioned store.
02In a real project using System Design, how would you apply, test, or troubleshoot URL shortener at scale?
Apply. For a marketing platform that embeds tracking links in SMS campaigns, I would run the redirect service as a stateless fleet behind a load balancer, store mappings in a key-partitioned store, and put a cache with a short TTL in front. Key generation would come from a separate service that pre-allocates blocks of base62 keys to each instance, so writes never contend on a global counter. Click events would be emitted asynchronously to a queue rather than written synchronously on the redirect path.
Test. Unit tests cover encoding, collision handling and expiry rules. Load tests replay a realistic Zipfian distribution of keys so the cache hit ratio in the test matches production, and assert p99 redirect latency stays under a few milliseconds above network time. A soak test verifies that key blocks are never reissued after instance restarts. I would also test that malformed or expired keys return 404 rather than redirecting to a default page.
Troubleshoot. The classic incident is a single viral link saturating one cache node or one database partition. Diagnosis comes from per-key request counters and partition-level latency; the fix is replicating hot keys across cache nodes or serving them from an in-process cache. A second symptom is duplicate keys appearing after a key-generator failover, which points to block allocation not being persisted before issue.
An important consideration is abuse: without rate limiting and link scanning, the shortener becomes a phishing tool and its domain gets blacklisted.
03Explain rate limiter design in the context of System Design.
A rate limiter bounds how many requests a client may make within a time window and rejects or delays the excess, protecting downstream services from overload and abuse. It is usually placed at the API gateway or as middleware in each service and keyed by user ID, API key or IP address.
Common algorithms and their trade-offs:
| Algorithm | Behaviour | Trade-off |
|---|---|---|
| Fixed window | Count per calendar window | Allows 2x burst at window edges |
| Sliding log | Store each request timestamp | Exact but memory-heavy |
| Sliding window counter | Weighted blend of two windows | Approximate, cheap, smooth |
| Token bucket | Refill tokens at rate r, burst up to b | Allows controlled bursts, most common |
| Leaky bucket | Fixed outflow rate | Smooths traffic, adds queueing delay |
In a distributed deployment the counters live in a shared store such as Redis, so every gateway instance sees the same count. Atomicity matters: increment-and-check must happen in one operation (a Lua script or INCR plus EXPIRE), otherwise concurrent requests slip through. Rejected requests return 429 Too Many Requests with a Retry-After header.
The token bucket logic fits in a few lines.
def allow(bucket, now, rate, capacity):
    elapsed = now - bucket.last_refill
    bucket.tokens = min(capacity, bucket.tokens + elapsed * rate)
    bucket.last_refill = now
    if bucket.tokens >= 1:
        bucket.tokens -= 1
        return True
    return False
Interview takeaway: name the algorithm, the key, where the state lives, and how you keep the check atomic across nodes.
04In a real project using System Design, how would you apply, test, or troubleshoot rate limiter design?
Apply. On a public payments API I would enforce two tiers: a per-API-key token bucket at the gateway for fairness between tenants, and a global concurrency limit in front of the core ledger service to protect it regardless of which tenant is noisy. Limits live in configuration keyed by plan tier, so sales can raise a customer’s quota without a deploy. Counters sit in a Redis cluster; the gateway fails open with a logged warning if Redis is unreachable, because blocking all traffic is worse than briefly over-admitting.
Test. Unit tests drive the algorithm with a fake clock and assert exact admit/reject sequences around window boundaries. Integration tests run several gateway replicas against one Redis and fire concurrent bursts, asserting the total admitted never exceeds the limit plus a documented tolerance. Chaos tests kill Redis mid-run to confirm the fail-open path and the alert.
Troubleshoot. When customers report unexpected 429s, I compare their request logs with the limiter’s decision logs, which record key, remaining tokens and the serving node. Typical causes are clock skew between gateway nodes, a key built from a header the client sends inconsistently, or a shared NAT IP collapsing many users into one bucket. Latency spikes at the gateway usually trace to Redis round trips; batching or local pre-admission with periodic sync fixes that.
A common mistake is forgetting that a limiter itself must be cheap: a 2 ms Redis call on every request is a meaningful fraction of a 20 ms SLO.
05Explain distributed cache in the context of System Design.
A distributed cache is a cluster of in-memory nodes that stores frequently read data closer to the application, so most reads avoid the database entirely. Clients locate the node holding a key through consistent hashing, which keeps remapping minimal when nodes join or leave.
Key design points:
- Placement. Cache-aside (application reads cache, on miss reads DB and populates) is the default; read-through and write-through push that logic into the cache layer. Write-behind buffers writes and risks loss.
- Eviction. LRU or LFU, bounded by memory per node, plus TTLs so stale entries age out even if invalidation is missed.
- Invalidation. Delete-on-write from the application, or event-driven invalidation from a change stream. Stale reads are the main correctness risk.
- Hot keys and thundering herd. A single popular key can overload one node; mitigations are key replication, local in-process caches and request coalescing so one miss triggers one DB read.
- Availability. Replicate shards so a node failure degrades hit ratio rather than causing an outage.
The diagram shows cache-aside with consistent hashing deciding the node.
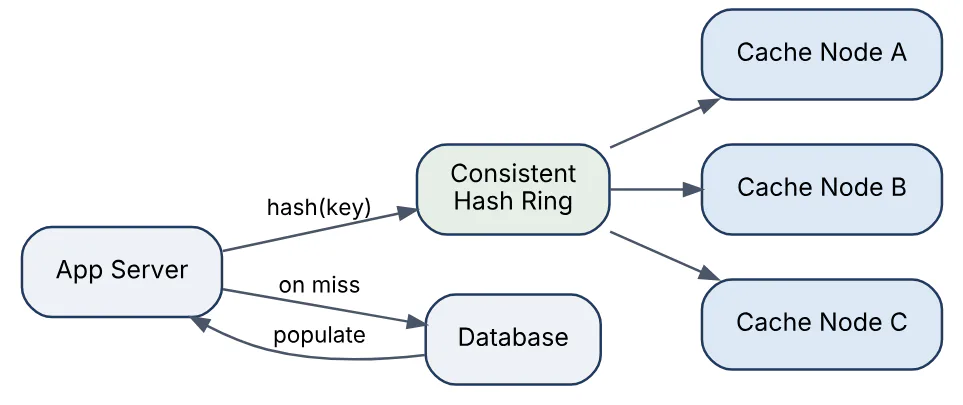
A hit ratio of 95% with 10,000 reads/s leaves the database with 500 reads/s, which is why cache capacity is sized to the working set, not the whole dataset.
06In a real project using System Design, how would you apply, test, or troubleshoot distributed cache?
Apply. In a product catalogue service for an e-commerce site I would cache product detail documents keyed by product ID with a 10-minute TTL, use cache-aside, and publish an invalidation message whenever the catalogue team updates a product. Session data would go into a separate cache cluster with different eviction settings, so a catalogue flush cannot log users out. Reads of the cache would carry a short timeout and fall back to the database, with the circuit breaker opening if the cache cluster is down.
Test. Integration tests confirm a write followed by a read returns fresh data within the invalidation window, and that a miss populates the cache exactly once under concurrent requests (request coalescing). Load tests measure hit ratio and database QPS at target traffic; a dashboard assertion fails the test if hit ratio drops below the planned threshold. Failover tests kill a cache node and check that error rates stay flat while latency rises only for the affected key range.
Troubleshoot. A sudden database CPU spike with normal traffic usually means mass eviction or a deploy that changed the key format, producing a cold cache; the fix is key versioning with warmup. Stale product prices after an update point to a missed invalidation, found by tracing the invalidation message through the queue. A hot-key problem shows as one node at 100% network while others idle; replicating that key or adding a local cache resolves it.
The important consideration is that a cache changes failure modes: the database must still survive the full load for the minutes it takes a cold cache to warm.
07Explain notification service in the context of System Design.
A notification service accepts events from many producers and delivers messages to users across channels (push, SMS, email, in-app) while respecting preferences, rate limits and delivery guarantees. It decouples the business services that generate events from the vendor integrations that send them.
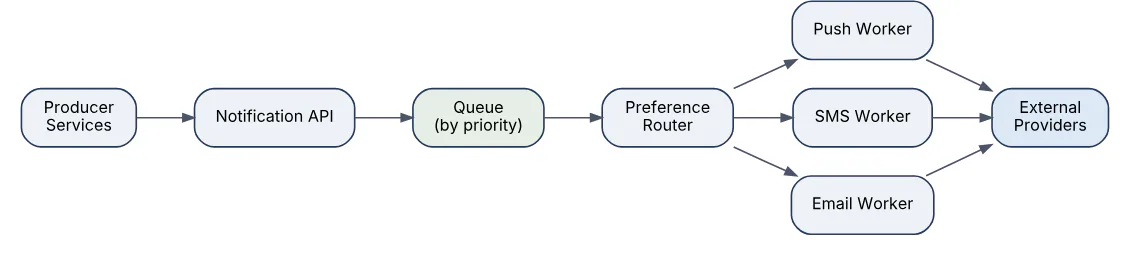
The pipeline typically has these stages:
- Ingest API validates the event and writes it to a durable queue; producers never block on vendor latency.
- Preference and routing looks up the user’s opt-ins, quiet hours and preferred channel, and expands a single logical notification into per-channel jobs.
- Templating renders localised content.
- Channel workers call the external provider (APNs, FCM, an SMS gateway, an email API), each with its own concurrency limits and retry policy.
- Delivery tracking records provider receipts and feeds analytics and retries.
Deduplication is essential: producers retry, queues redeliver, and sending the same alert twice erodes trust. A notification ID stored in a short-lived idempotency table prevents it. Priority queues separate time-critical alerts (two-factor codes) from bulk marketing so a campaign cannot delay a login code.
The flow from producer to channel provider looks like this.
08In a real project using System Design, how would you apply, test, or troubleshoot notification service?
Apply. For a banking app I would route transaction alerts, OTP codes and marketing through one service with three priority queues. OTPs bypass preference checks and quiet hours and have a 30-second delivery deadline, after which the worker falls back from push to SMS. Each channel worker is a separate deployment so an SMS provider outage cannot starve push throughput. Provider credentials and per-provider rate limits live in configuration, and every send is written with an idempotency key derived from event ID plus channel.
Test. Contract tests run against provider sandboxes to catch payload format changes. Integration tests publish an event and assert exactly one row per channel in the delivery table even when the producer sends the event three times. Load tests push a campaign of a million messages while a stream of OTPs runs in parallel, asserting OTP p99 latency is unaffected. Template tests render every locale and fail on missing variables.
Troubleshoot. “I never got my code” reports are diagnosed by following the notification ID through ingest, routing and provider receipt logs; common causes are an expired device token, a provider rejection buried in an async callback, or a preference flag set by a previous opt-out. Rising queue depth with healthy workers suggests a provider throttling us, visible as 429 counts per provider, and the fix is backing off and shifting traffic to a secondary provider.
One consideration: delivery receipts arrive asynchronously and out of order, so status must be modelled as a state machine with monotonic transitions, not overwritten by the latest callback.
09Explain chat messaging platform in the context of System Design.
A chat platform delivers messages between users in near real time, stores history, and tracks presence. The core challenge is maintaining millions of long-lived connections while guaranteeing that messages arrive in order and exactly once from the user’s point of view.
Key components and decisions:
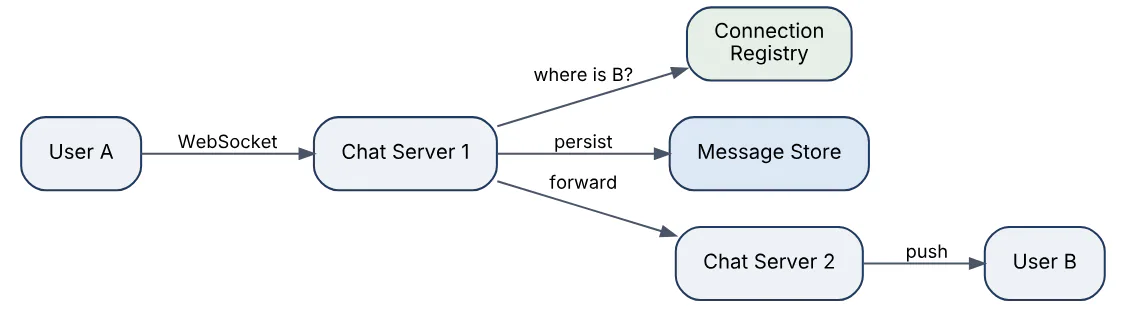
- Connection layer. Clients hold a WebSocket to a chat server; a connection registry (user → server) lets the system route a message to whichever server holds the recipient’s socket. Each server handles tens of thousands of idle connections, so a few hundred servers cover millions of users.
- Message flow. Sender → their chat server → persist to the message store → look up recipient’s server → push. If the recipient is offline, the message waits in storage and a push notification is triggered.
- Storage. A wide-column store keyed by conversation ID with messages clustered by a time-ordered ID gives cheap “load the last 50 messages” reads. Message IDs come from a per-conversation sequence or a Snowflake-style generator so ordering is deterministic.
- Group chat. Fan-out on write to each member’s inbox for small groups; for very large channels, fan-out on read.
- Presence. Heartbeats update a last-seen timestamp in a cache; absence of heartbeats for a threshold marks the user offline.
The diagram shows a message crossing two chat servers.
10In a real project using System Design, how would you apply, test, or troubleshoot chat messaging platform?
Apply. Building customer-support chat for a retailer, I would terminate WebSockets on a stateless connection tier, keep the user-to-server mapping in a replicated cache with a TTL refreshed by heartbeats, and route cross-server messages through a pub/sub topic per server rather than direct connections. Messages are written to a conversation-partitioned store before any acknowledgement is sent to the sender, and the client receives a server-assigned sequence number so it can detect gaps and request a resync.
Test. A simulator opens hundreds of thousands of idle connections per test to validate memory per connection and heartbeat overhead. Ordering tests send interleaved messages from two senders in one conversation and assert both clients render the same order. Reconnect tests drop a client mid-conversation and check it receives every missed message exactly once on resume. Chaos tests kill a chat server and measure how long until its users reconnect elsewhere and the registry stops routing to the dead node.
Troubleshoot. Messages shown out of order usually mean clients are sorting by local receive time instead of server sequence. Messages lost after a server crash point to acknowledging before persistence. A thundering-herd reconnect after a deploy is visible as a spike in registry writes and connection attempts; adding jittered reconnect backoff to the client resolves it. Stale presence (“online” for a gone user) is almost always a missed disconnect event, so presence must expire by TTL, not rely on explicit offline messages.
The main consideration is that end-to-end encryption, if required, removes the server’s ability to search or moderate content, which changes the storage and compliance design fundamentally.
11Explain news feed service in the context of System Design.
A news feed assembles a personalised, ranked list of recent posts from the accounts a user follows. The design hinges on choosing between fan-out on write and fan-out on read, and most real systems use a hybrid.
- Fan-out on write (push). When a user posts, the system writes the post ID into the feed cache of every follower. Reading a feed is then a single cache lookup, which is fast. The cost is write amplification: a celebrity with 50 million followers triggers 50 million writes per post.
- Fan-out on read (pull). The feed is built at read time by querying recent posts from each followed account and merging. Writes are cheap, reads are expensive and slow for users following thousands of accounts.
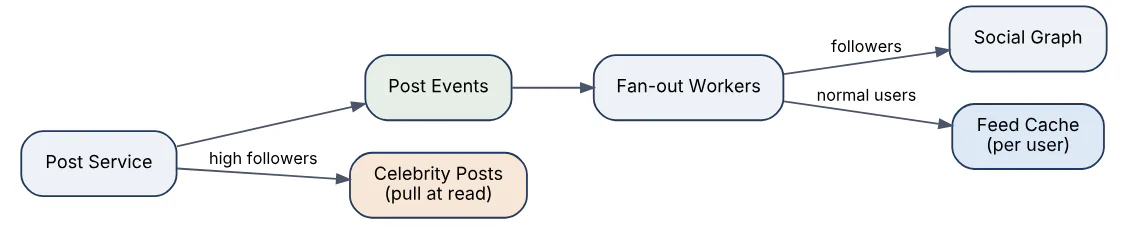
- Hybrid. Push for ordinary users, pull for accounts above a follower threshold; the read path merges the precomputed feed with the celebrity posts.
Other components: a post service that persists content and publishes an event, fan-out workers that consume it and update feed caches (storing only post IDs, typically the latest few hundred), a ranking service that reorders candidates by predicted engagement, and a hydration step that fetches post bodies and author details before returning the page.
The hybrid write path is shown below.
12In a real project using System Design, how would you apply, test, or troubleshoot news feed service?
Apply. For a professional networking product I would set the celebrity threshold at a configurable follower count, store each user’s feed as a capped sorted set of post IDs in a cache cluster, and run fan-out through a partitioned stream so workers scale horizontally. Inactive users (no login in 30 days) would be skipped during fan-out and rebuilt lazily on their next visit, which cuts write volume dramatically. Ranking would be a separate service called at read time with the candidate IDs, so model changes never touch the fan-out path.
Test. Correctness tests create a follow graph in a test environment, post from several accounts and assert each feed contains exactly the expected IDs in order, including the merge with pull-path celebrity posts. Load tests simulate a high-follower account posting and measure fan-out completion time and stream lag. Read-path latency tests fetch feeds with cold and warm caches and verify hydration batches requests rather than issuing one call per post.
Troubleshoot. Posts appearing minutes late for some followers indicate stream lag on a hot partition, often because one celebrity’s followers all hash to the same key; repartitioning by follower ID fixes it. Deleted posts still showing means the delete event did not trigger feed cache removal. Duplicate items usually trace to a retried fan-out job without idempotent writes; using a set rather than a list in the cache resolves it.
The key consideration is that the feed is an approximation by design; chasing strict completeness or ordering guarantees costs far more than users notice.
13Explain video streaming platform in the context of System Design.
A video streaming platform ingests uploaded video, transcodes it into multiple bitrates and formats, stores the segments, and delivers them through a CDN using adaptive bitrate streaming so playback adjusts to the viewer’s bandwidth.
Upload and processing path:
- The client uploads in resumable chunks to object storage; the API records metadata and enqueues a processing job.
- A transcoding pipeline splits the video into short segments (typically 2–10 seconds) and encodes each at several resolutions in parallel, producing an HLS or DASH manifest that lists the variants. Thumbnails, captions and content-safety checks run as parallel steps in the same DAG.
- Outputs are written to object storage and the video is marked ready.
Playback path:
- The player fetches the manifest, picks a bitrate based on measured throughput, and requests segments from the CDN edge. The CDN caches segments; origin storage sees only cache misses.
- Metadata (title, view count, recommendations) comes from ordinary services and caches, separate from the media path.
Storage estimate: one hour of video encoded into five renditions totalling roughly 10 Mbps aggregate is about 4.5 GB; this drives decisions such as cold tiering of rarely watched content and lazy transcoding of less popular resolutions.
The end-to-end pipeline is below.

14In a real project using System Design, how would you apply, test, or troubleshoot video streaming platform?
Apply. For an internal training video platform I would use resumable uploads directly to object storage via pre-signed URLs so the API tier never handles media bytes. Transcoding runs as a DAG on a worker pool with spot or preemptible capacity, since jobs are idempotent and restartable per segment. I would transcode the two most common renditions immediately and the rest on first demand, and serve everything through a CDN with signed URLs that expire, since the content is access-controlled.
Test. Pipeline tests feed a corpus of awkward inputs (variable frame rate, rotated phone video, odd aspect ratios, corrupt trailing bytes) and assert valid manifests and playable segments. Playback tests use a headless player under throttled network profiles to verify bitrate switching happens without stalls and start-up time stays within budget. CDN tests confirm cache hit ratios on segments and that expired signed URLs are rejected at the edge, not at origin.
Troubleshoot. Buffering complaints concentrated in one region point to a CDN edge with poor origin connectivity or low cache hit ratio; edge logs show miss ratio per POP. Videos stuck in “processing” are usually a failed DAG step with a poison input; dead-letter queues and per-step status make the failing segment visible. Audio drift after transcoding indicates timestamp handling bugs in segmenting, caught by comparing audio and video segment durations.
A key consideration is that storage, not compute, dominates long-term cost, so the rendition ladder and retention policy deserve as much design attention as the transcoder.
15Explain search autocomplete in the context of System Design.
Search autocomplete returns the most likely completions for a partially typed query within a few tens of milliseconds, on every keystroke. The design separates an offline pipeline that computes top suggestions from an online read path that must be extremely fast.
Online path:
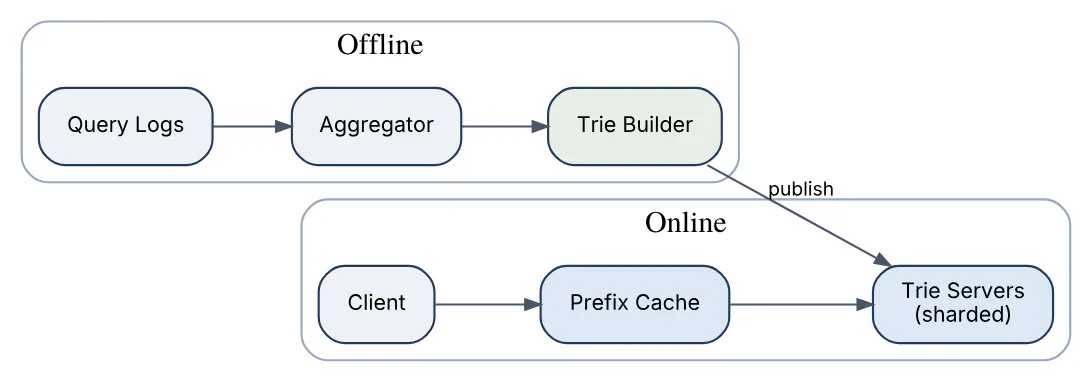
- The client debounces keystrokes and sends the prefix. The service looks up the prefix in a trie where each node stores the precomputed top-k completions (typically k = 5–10) for that prefix, so a lookup is one traversal with no sorting at query time.
- The trie is sharded by prefix range across servers and held in memory; a cache in front handles the most common short prefixes, which dominate traffic.
- Results are filtered for the user’s language and against a blocklist before returning.
Offline path:
- Query logs are aggregated (hourly or daily) to count frequencies, weighted toward recent activity.
- A builder constructs a new trie with top-k lists per node and publishes it; servers swap to the new version atomically.
Personalisation and trending terms are layered in at read time by merging a small per-user or real-time candidate set with the trie results.
The two paths are shown below.
16In a real project using System Design, how would you apply, test, or troubleshoot search autocomplete?
Apply. For an e-commerce search box I would build the trie from the last 30 days of successful queries (those that led to a click), weighted by recency, and rebuild it nightly with a smaller hourly delta for trending terms. Suggestions are served from an in-memory trie behind a CDN-style cache for prefixes of one to three characters, which account for most requests. The client waits 100 ms after the last keystroke and cancels in-flight requests so stale responses never overwrite newer ones.
Test. Unit tests verify top-k ordering and tie-breaking in the trie. Golden tests compare suggestions for a fixed set of prefixes between the old and new trie builds and flag large changes for review before publish. Latency tests assert p99 under 50 ms server side at projected QPS. Content tests run the blocklist against every stored suggestion so offensive completions never ship.
Troubleshoot. Suggestions suddenly disappearing for a category usually trace to a broken log-ingestion job producing an under-counted build; build-time metrics on total query volume catch it before publish. Stale suggestions for days means the swap to the new trie failed on some shards, detectable by exposing the build version per server. Spikes in latency often come from very long prefixes bypassing the cache and traversing deep tries, solved by capping the prefix length used for lookup.
The main consideration is that autocomplete leaks aggregate user behaviour; rare queries must be filtered by a minimum frequency so a single person’s searches never surface as a suggestion.
17Explain file storage like Dropbox in the context of System Design.
A Dropbox-style system synchronises files across a user’s devices and the cloud, keeping every copy consistent while minimising bandwidth. The central ideas are chunking, content addressing and a metadata service separate from blob storage.
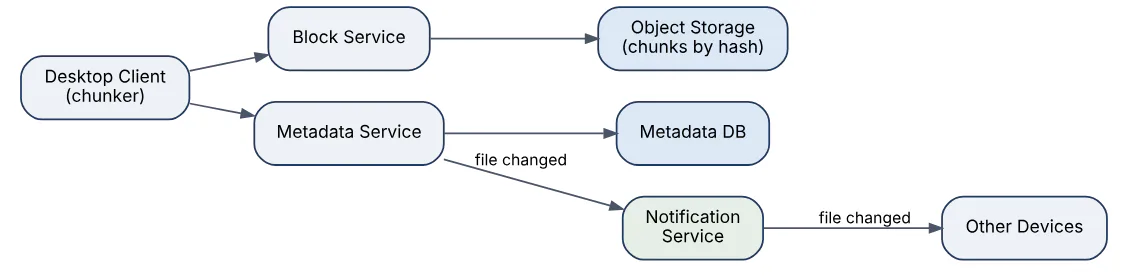
- Chunking and deduplication. Files are split into chunks (for example 4 MB). Each chunk is hashed and stored once in object storage keyed by hash. Changing one part of a large file uploads only the changed chunks.
- Metadata service. A relational or strongly consistent store holds the namespace: file paths, versions, the ordered list of chunk hashes per version, and permissions. Metadata changes are small and must be consistent; blob storage is large and eventually consistent is fine.
- Sync protocol. The client watches the local filesystem, computes chunk hashes, uploads missing chunks, then commits a new metadata version. Other devices receive a change notification (long-polling or WebSocket) and download only the chunks they lack.
- Conflict handling. If two devices edit the same file offline, the server keeps both versions and renames one as a conflicted copy rather than merging.
- Versioning. Since chunks are immutable and content-addressed, keeping old versions costs only metadata plus the unique chunks.
The separation of metadata and block paths is shown below.
18In a real project using System Design, how would you apply, test, or troubleshoot file storage like Dropbox?
Apply. For an enterprise document-sync product I would use content-defined chunking rather than fixed offsets so an insert at the start of a file does not invalidate every chunk. Chunk uploads go straight to object storage with pre-signed URLs; the metadata commit is a single transaction that references the chunk hashes and fails if any chunk is missing. Clients hold a per-folder cursor so change notifications are a cheap “fetch deltas since cursor” call. Encryption at rest uses per-tenant keys, so deduplication is scoped within a tenant, never across customers.
Test. Property-based tests chunk random files, reassemble them from stored hashes and assert byte equality. Sync tests run two simulated clients editing the same file offline and verify the conflicted-copy outcome rather than data loss. Bandwidth tests confirm a one-byte append to a 1 GB file uploads a single chunk. Restore tests roll a file back to a 30-day-old version and verify every referenced chunk still exists, which validates the garbage collector’s reference counting.
Troubleshoot. A client stuck “syncing” forever is usually a metadata commit retry loop caused by a chunk upload that silently failed; the commit error should name the missing hash. Phantom conflicts appear when clocks or modification times are trusted instead of version vectors. Storage growth outpacing user data points to garbage collection falling behind or reference counts drifting after failed commits.
The critical consideration is that garbage-collecting chunks is the most dangerous operation in the system; a reference-count bug deletes customer data, so GC should run with a grace period and be independently auditable.
19Explain ride hailing matching in the context of System Design.
Ride-hailing matching pairs a rider’s trip request with a nearby available driver within seconds, while continuously tracking thousands of moving vehicles. The two hard parts are efficient geospatial indexing of moving points and making a fair, low-latency assignment under contention.
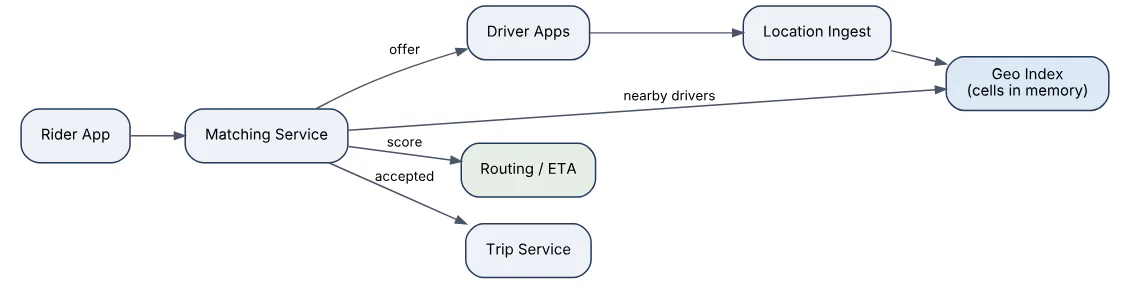
- Location ingestion. Drivers send GPS updates every few seconds. These are written to an in-memory geospatial index, not a database, because the data is high-volume and only the latest position matters.
- Spatial index. The map is divided into cells using geohash, S2 or H3. Each cell holds the set of available drivers. A search for a rider’s pickup expands outward through neighbouring cells until enough candidates are found. Cell size balances precision against the number of cells to scan.
- Candidate ranking. Candidates are scored by estimated time of arrival from a routing service, not straight-line distance, plus driver rating and acceptance history.
- Dispatch. The top driver is offered the trip with a short timeout; on decline it moves to the next. To prevent two riders being offered the same driver, the driver’s state is transitioned atomically (available → offered) in the index.
- Trip lifecycle. Once accepted, a trip service owns the state machine (en route, arrived, in progress, completed) and location streaming to the rider.
Batching requests within a small window (one to two seconds) and solving an assignment problem across all of them improves global efficiency over greedy per-request matching.
20In a real project using System Design, how would you apply, test, or troubleshoot ride hailing matching?
Apply. For a regional delivery-courier platform I would partition the geo index by city so each city’s matching runs independently and a hot metro cannot slow a quiet one. Courier positions are kept in a cache with a 30-second TTL so a dropped connection removes them automatically. Matching runs in two-second batches per city, scoring candidates by routing ETA with a cached fallback to haversine distance when the routing service is slow. Offers carry a 15-second expiry and the courier state transition is a compare-and-set in the cache.
Test. Simulation is the main tool: a replayed day of real request and position traces runs against the matcher, and metrics such as average pickup ETA, unmatched rate and offers per trip are compared between algorithm versions. Concurrency tests fire simultaneous requests near one courier and assert exactly one offer. Load tests push position updates at peak rates to confirm the index keeps up without lag.
Troubleshoot. Riders seeing “no drivers” while drivers sit idle usually means stale state in the index, such as couriers stuck in “offered” after a crashed matcher; a sweeper that expires stale offers fixes it. Long pickup times in one area point to cell size being too coarse or the ETA service timing out and degrading to straight-line distance, which is visible in the fallback counter. Position lag shows up as couriers “jumping” on the rider’s map and traces to ingest backpressure.
The important consideration is that matching quality and latency conflict directly: longer batching windows produce better global assignments but every added second is visible to a waiting rider.
21Explain payment processing in the context of System Design.
Payment processing moves money between parties reliably, exactly once, with a complete audit trail, despite network failures and third-party processors that may be slow or inconsistent. Correctness matters more than throughput; a duplicated charge is a serious incident.
Core design elements:
- Idempotency. Every payment request carries a client-generated idempotency key. The service stores the key with the outcome and returns the stored result on retry, so a timed-out request can be safely resubmitted.
- Ledger. A double-entry ledger records every movement as balanced debit and credit entries in an append-only table. Balances are derived, never updated in place, which makes reconciliation and audit straightforward.
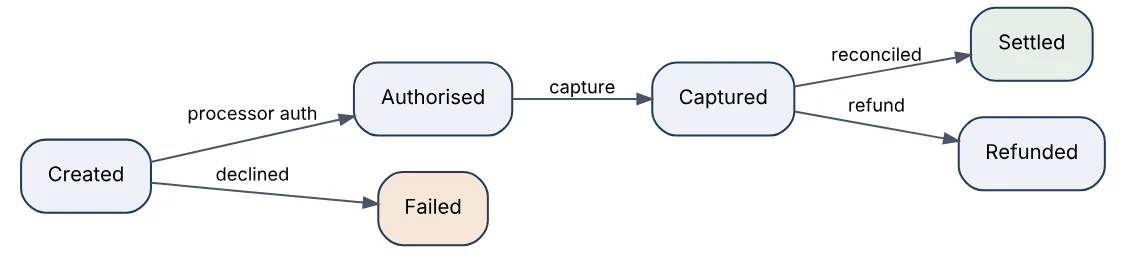
- State machine. A payment moves through explicit states (created → authorised → captured → settled, or failed/refunded). Transitions are persisted before any external call and are the source of truth for retries.
- Processor integration. Calls to the card network or bank go through an adapter with timeouts, retries only on idempotent operations, and a reconciliation job that compares our records with the processor’s daily settlement file.
- Isolation. Card data is kept in a tokenisation vault to limit PCI DSS scope; the rest of the platform sees only tokens.
The state progression and where external calls sit are shown here.
22In a real project using System Design, how would you apply, test, or troubleshoot payment processing?
Apply. In a marketplace checkout I would make the payment service the only component allowed to call the processor, with the order service sending a request carrying the order ID as idempotency key. The service writes the intent and state to its database in one transaction, then calls the processor with a strict timeout. An outbox table publishes payment.captured events so downstream fulfilment reacts without the payment path depending on the message broker being up. Refunds and captures go through the same state machine with the same idempotency rules.
Test. Unit tests enumerate every state transition, including invalid ones that must be rejected. Integration tests against the processor’s sandbox cover declines, 3-D Secure challenges and network timeouts injected by a fault proxy, asserting that a retry after a timeout never produces a second charge. A nightly reconciliation test compares ledger totals against the sandbox settlement report. Property tests check that the sum of all ledger entries is always zero.
Troubleshoot. A customer charged twice is diagnosed by searching the idempotency table for both processor references; the usual cause is the client generating a new key on retry. Payments stuck in “authorised” indicate the capture job crashed after the processor call but before the state write, so a recovery job must query the processor for the truth. Reconciliation mismatches are triaged by category (timing, currency rounding, chargebacks) with rounding differences handled by storing amounts in minor units as integers.
One consideration dominates: when the processor response is lost, the system must not guess; it must query the processor’s status endpoint before deciding to retry or fail.
23Explain distributed job scheduler in the context of System Design.
A distributed job scheduler runs tasks at specified times or intervals across a fleet of workers, guaranteeing that each job runs when due, exactly once (or at least once with idempotent handlers), even when scheduler nodes fail.
Main components:
- Job store. A durable table of job definitions: schedule (cron or one-off), payload, retry policy, timeout, and the next due time, indexed by
next_run_at. - Scheduler (dispatcher). Polls for jobs whose due time has passed and enqueues an execution record. Running several scheduler instances requires either leader election so only one dispatches, or partitioning the job space so each instance owns a shard. Claiming a job uses an atomic update (
UPDATE ... WHERE status='due') so two dispatchers cannot both take it. - Queue. Decouples dispatch from execution and absorbs bursts when thousands of jobs are due at the same minute.
- Workers. Pull executions, run them with a timeout, send heartbeats, and record success or failure. A missed heartbeat lets the scheduler requeue the job.
- Retry and dead-letter handling. Failed jobs retry with exponential backoff up to a limit, then land in a dead-letter list for inspection.
Priority queues, per-tenant concurrency limits and DAG dependencies (job B after job A) are common extensions.

24In a real project using System Design, how would you apply, test, or troubleshoot distributed job scheduler?
Apply. For a SaaS platform running nightly report generation and hourly data syncs for thousands of tenants, I would store job definitions in a relational table with an index on (status, next_run_at), run two scheduler instances with a lease-based leader, and dispatch to a queue partitioned by tenant so one tenant’s backlog cannot delay others. Workers would be stateless containers autoscaled on queue depth. Every handler is written to be idempotent, keyed on the execution ID, since redelivery after a worker crash is expected behaviour, not an error.
Test. Unit tests cover cron parsing and next-run computation across DST transitions. Integration tests run two schedulers against one database and assert each due job is claimed exactly once under concurrent polling. Fault tests kill a worker mid-job and verify the heartbeat timeout triggers requeue within the configured window. A load test schedules 50,000 jobs for the same minute to check dispatch throughput and queue behaviour.
Troubleshoot. Jobs running late shows as growing distance between next_run_at and actual start; causes include a slow poll query missing its index or worker exhaustion by a few long jobs. Duplicate executions trace to a lease expiring while the old leader still believed it was leading, so leases must be checked before each dispatch, not just at election. Jobs silently never running usually means a handler exception marked them failed without alerting, which a dead-letter alert fixes.
The key consideration is that “exactly once” is unattainable across a crash boundary; the system delivers at least once and the handlers supply idempotency.
25Explain API gateway in the context of System Design.
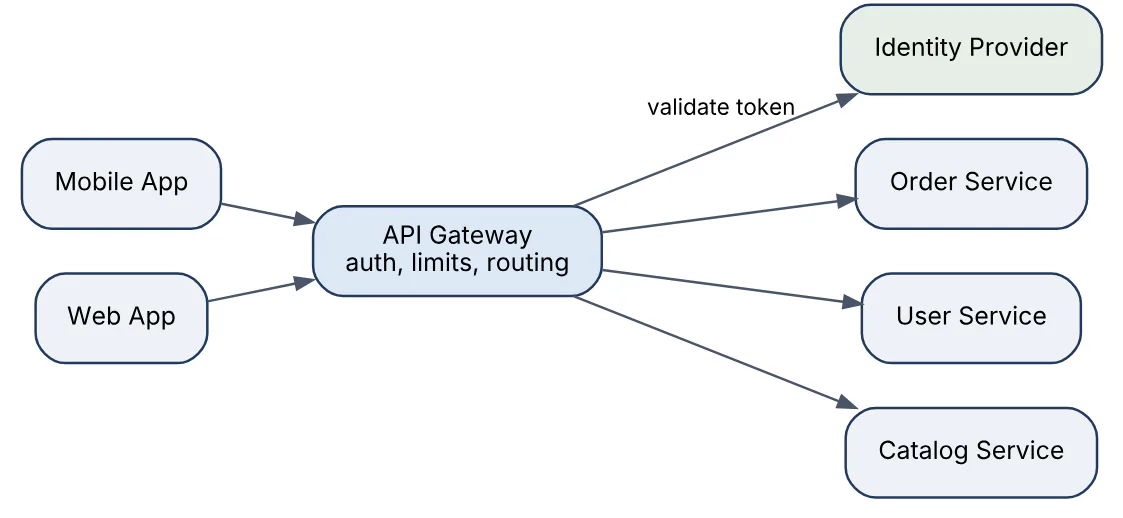
An API gateway is the single entry point through which external clients reach a set of backend services. It terminates TLS, authenticates the caller, applies rate limits, routes each request to the right service, and often aggregates or transforms responses, so individual services do not each reimplement these concerns.
Responsibilities commonly centralised in the gateway:
- Routing by path, host or header to the correct service, with versioning (
/v1/orders). - Authentication and authorisation by validating JWTs or API keys and forwarding identity to services as trusted headers.
- Traffic control: rate limiting, quotas, request size limits and circuit breaking toward unhealthy backends.
- Protocol translation: REST on the outside, gRPC internally, or WebSocket upgrades.
- Observability: uniform access logs, request IDs and metrics for every call.
- Response aggregation for mobile clients that would otherwise make several round trips (the backend-for-frontend pattern).
The gateway is a hot path, so it must be stateless and horizontally scaled, with any shared state (rate-limit counters, routing config) in an external store. It differs from a load balancer, which operates at the connection or request level without application awareness, and from a service mesh, which handles service-to-service traffic inside the cluster.
26In a real project using System Design, how would you apply, test, or troubleshoot API gateway?
Apply. Fronting a set of microservices for a travel-booking product, I would deploy the gateway as an autoscaled stateless tier with routing rules stored in version-controlled configuration and pushed via the gateway’s control plane. JWT validation happens at the gateway using cached signing keys from the identity provider; services receive the verified claims in a header and trust nothing else from the outside. Per-client rate limits and a global circuit breaker per backend protect services, and a request ID is injected on entry and propagated everywhere.
Test. Route tests send a request for every published path and assert it lands on the expected service and version. Security tests include expired, malformed and wrong-audience tokens, plus attempts to spoof the identity header from outside, which must be stripped. Performance tests measure the gateway’s added latency at target throughput, with a budget of a few milliseconds at p99. Canary tests validate a new routing configuration against a small slice of traffic before full rollout.
Troubleshoot. A spike in 502s from one route usually means the backend’s health check is passing while real requests time out; comparing gateway upstream latency to the service’s own metrics isolates it. Intermittent 401s after a key rotation point to the gateway caching old JWKS keys too long. Overall latency creep often traces to the gateway making synchronous calls (auth lookups, config fetches) on every request instead of caching.
The main consideration is that the gateway is a single point of failure and a tempting dumping ground for business logic; it must stay thin and highly available.
27Explain load balancer strategies in the context of System Design.
A load balancer spreads incoming requests across a pool of servers and removes unhealthy ones from rotation. The strategy determines how the next server is chosen and has a direct effect on tail latency and resource usage.
| Strategy | How it chooses | Best for |
|---|---|---|
| Round robin | Next server in order | Homogeneous servers, uniform requests |
| Weighted round robin | Proportional to assigned weight | Mixed instance sizes, canary traffic |
| Least connections | Fewest active connections | Long-lived or variable-duration requests |
| Least response time | Lowest recent latency | Latency-sensitive APIs |
| IP or consistent hash | Hash of client or key | Session affinity, cache locality |
| Random two choices | Pick 2 at random, take less loaded | Large pools; avoids herd effects |
Other dimensions matter as much as the algorithm:
- Layer. L4 balancers forward TCP/UDP by IP and port and are very fast; L7 balancers parse HTTP and can route by path, header or cookie, terminate TLS and retry failed requests.
- Health checks. Active probes plus passive detection (consecutive errors) decide when to eject a server; too aggressive and a brief GC pause removes capacity, too lenient and clients see errors.
- Connection draining lets in-flight requests finish before a server is removed.
- Global load balancing uses DNS or anycast to pick a region before the regional balancer picks a server.
Consistent hashing is the right answer when the backend holds per-key state, such as a cache tier, because adding a node moves only a small fraction of keys.
28In a real project using System Design, how would you apply, test, or troubleshoot load balancer strategies?
Apply. For a public API with a mix of fast lookups and slow report exports, I would terminate TLS at an L7 balancer, route /exports to a dedicated pool using least-connections (since request durations vary widely) and route everything else with round robin across identically sized instances. The cache tier behind the services would use consistent hashing so each key lands on the same node. Deploys use weighted routing to send 5% of traffic to the new version first. Health checks hit a dedicated endpoint that verifies the service’s dependencies, not just that the process is up.
Test. Distribution tests send a fixed number of requests and assert each backend receives its expected share within tolerance. Failover tests stop one backend and measure how many requests fail before ejection, which validates the health-check interval and threshold. Draining tests trigger a scale-in during a load test and confirm zero connection resets. For consistent hashing, a test adds a node and asserts the fraction of keys remapped is close to 1/n.
Troubleshoot. One backend running hot while others idle under round robin usually means keep-alive connections from a few heavy clients are pinned to it; moving to least-connections or limiting requests per connection fixes it. Flapping backends (ejected and readmitted repeatedly) point to a health check that is too sensitive or shares a dependency that is itself unstable. Uneven cache load after scaling indicates a hash ring with too few virtual nodes.
The consideration to raise is that least-connections can amplify a problem: a backend that fails fast has few open connections and attracts more traffic, so health checks and outlier ejection must be configured alongside it.
29Explain database sharding in the context of System Design.
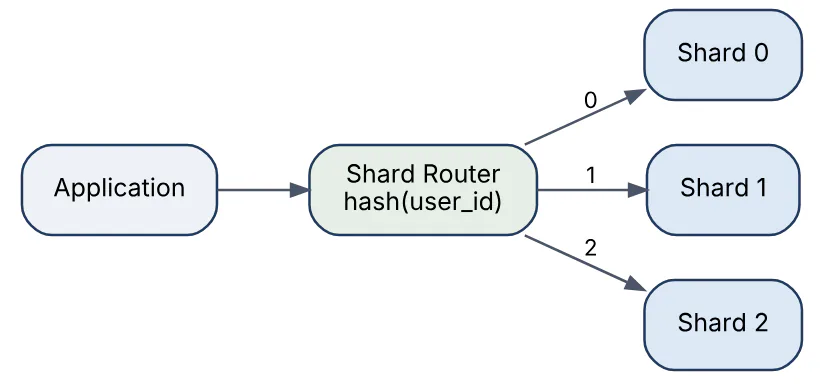
Sharding splits one logical database horizontally across several independent database servers, each holding a subset of rows, so that write throughput and storage can grow beyond a single machine. Every row has a shard key that determines which shard owns it.
Sharding strategies:
- Range-based. Contiguous key ranges per shard (users A–F on shard 1). Supports range scans but creates hotspots when keys are sequential, such as timestamps.
- Hash-based.
hash(key) mod nor consistent hashing. Distributes evenly but makes range queries scatter across all shards. - Directory-based. A lookup service maps each key to a shard, allowing arbitrary placement and easy migration at the cost of an extra hop and another component to keep available.
Choosing the shard key is the critical decision. It should appear in most queries (so they hit one shard), distribute load evenly, and rarely change. Tenant ID or user ID is typical.
Sharding has real costs: cross-shard joins and transactions become application problems, unique constraints hold only within a shard, resharding when a shard outgrows its machine requires data movement, and operational tooling multiplies. Most teams delay sharding as long as read replicas, caching and vertical scaling will carry them.
30In a real project using System Design, how would you apply, test, or troubleshoot database sharding?
Apply. For a multi-tenant SaaS whose single database had reached write limits, I would shard by tenant ID using consistent hashing over a fixed number of logical shards (say 1,024) mapped onto a smaller number of physical servers; moving a logical shard between servers later needs no key changes. A routing library in the data access layer resolves tenant → shard, and every table carries the tenant ID so queries never need cross-shard joins. Reference data shared by all tenants is replicated to every shard rather than looked up remotely.
Test. Distribution tests hash the real tenant list and assert no physical server holds more than a set percentage of rows or traffic. Migration tests move a logical shard while a load generator writes to it, verifying zero lost or duplicated rows via checksums before cut-over. Query tests fail the build if any query lacks a tenant predicate, caught by a linter on the ORM layer. Failure tests take one shard offline and confirm other tenants are unaffected.
Troubleshoot. One shard at high CPU while others idle is a hotspot tenant; the fix is giving that tenant a dedicated physical server by remapping its logical shard. Slow aggregate reports indicate scatter-gather queries, better served from a separate analytics store fed by change-data-capture. Mysterious missing rows after a migration almost always trace to writes that landed on the old shard during cut-over, which dual-write with a verification pass prevents.
The important consideration is that the shard key is nearly impossible to change later, so it deserves more deliberation than any other schema decision.
31Explain replication consistency in the context of System Design.
Replication keeps copies of data on multiple nodes for availability and read scaling; consistency describes what guarantees a reader gets about seeing the latest write. The two are in tension because waiting for every replica to acknowledge a write costs latency and availability.
Replication modes:
- Synchronous. The leader waits for followers to confirm before acknowledging. Strong consistency, higher write latency, and a slow follower slows everyone.
- Asynchronous. The leader acknowledges immediately and ships changes later. Fast writes, but followers lag and a leader failure can lose acknowledged writes.
- Semi-synchronous / quorum. Wait for a majority (W + R > N). Tunable per operation, the approach used by Dynamo-style stores.
Consistency models readers may observe:
| Model | Guarantee |
|---|---|
| Strong (linearizable) | Every read sees the latest committed write |
| Read-your-writes | A client sees its own writes immediately |
| Monotonic reads | A client never sees data go backwards in time |
| Causal | Causally related writes are seen in order |
| Eventual | Replicas converge given no new writes; no ordering promise |
Practical techniques: route a user’s reads to the leader for a short window after their write, pin a session to one replica for monotonic reads, and include a version or log position in the client’s token so a replica can refuse to serve a read until it has caught up. Replication lag is the metric to watch; it should be measured in log position, not wall-clock seconds alone.
32In a real project using System Design, how would you apply, test, or troubleshoot replication consistency?
Apply. In an order-management system with one primary and several read replicas, I would send all writes and any read inside a checkout flow to the primary, route catalogue and history reads to replicas, and implement read-your-writes for the user’s own orders by returning the primary’s log position in a cookie after each write; the replica-side router checks its applied position and falls through to the primary if it is behind. Replication lag is exported as a metric with alerting at a threshold tied to the UI’s tolerance.
Test. Integration tests introduce artificial replication delay (a paused replica or a network delay tool) and assert a user who places an order sees it in their list on the very next request. Failover tests promote a replica during a write-heavy load test and count lost or duplicated writes, which validates whether semi-synchronous replication is actually configured. Monotonic-read tests hammer a session with alternating reads and assert the returned version never decreases.
Troubleshoot. Users reporting a disappeared order that reappears seconds later is the signature of a read hitting a lagging replica without the position check. Ever-growing lag on one replica usually means a long-running query holding it back or undersized hardware; replica-level apply metrics show which. After an unplanned failover, duplicate order numbers mean the old primary accepted writes that were never replicated, requiring reconciliation from application logs.
The consideration to state is that asynchronous replication trades durability of the last few writes for latency, and that trade must be acceptable to the business for the data in question.
33Explain CAP theorem tradeoffs in the context of System Design.
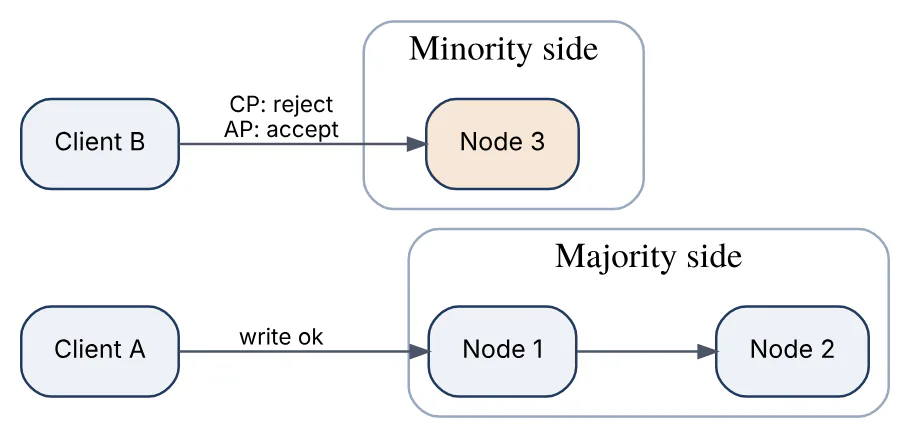
The CAP theorem states that a distributed data store cannot simultaneously guarantee consistency (every read sees the most recent write), availability (every request receives a non-error response) and partition tolerance (the system continues operating when network messages are lost) during a network partition. Since partitions are a fact of life in any real network, the practical choice is between consistency and availability when a partition occurs.
- CP systems refuse or delay requests on the minority side of a partition to avoid serving stale or conflicting data. Coordination services (ZooKeeper, etcd) and most relational databases with synchronous replication behave this way.
- AP systems keep serving reads and writes on both sides and reconcile later, accepting temporary divergence. Dynamo-style stores and DNS are examples.
Two refinements matter in interviews. First, the choice applies only during partitions; in normal operation a system can be both consistent and available, and the real everyday trade-off is between consistency and latency (the PACELC formulation). Second, the choice can be made per operation, not per system: a shopping cart might accept writes everywhere (AP) while checkout requires a quorum (CP).
The diagram shows a partition splitting a three-node cluster; the minority side must choose to reject writes (CP) or accept them and diverge (AP).
34In a real project using System Design, how would you apply, test, or troubleshoot CAP theorem tradeoffs?
Apply. In a retail platform spanning two regions, I would classify each data domain explicitly. Inventory reservation at checkout is CP: it goes through a single-leader store and fails fast if the leader’s region is unreachable, because overselling is worse than a brief error. Product views, wish lists and the shopping cart are AP: they are written locally with last-writer-wins or CRDT merge and replicated asynchronously, because a stale cart is tolerable and losing the ability to browse during a partition is not. These decisions are written down per table so nobody later assumes a guarantee the store does not give.
Test. Partition tests using a network fault tool isolate one region and run the checkout and cart flows concurrently, asserting checkout returns errors (not oversells) on the isolated side and cart writes succeed and merge correctly after healing. Jepsen-style tests on the CP store check for stale reads and lost writes under partition plus leader failover. Chaos game days rehearse the operational response.
Troubleshoot. Oversold inventory after an incident means the “CP” store was actually configured with asynchronous replication or a failover promoted a lagging replica; the replication settings and failover logs confirm it. Carts losing items after a partition heals indicate a merge strategy that discards concurrent updates. Elevated error rates on the minority side are the expected cost of CP and should be documented so they are not mistaken for a bug.
The consideration is that most outages are not clean partitions but partial slowness, where a CP system’s timeouts and an AP system’s conflict rates both degrade gradually.
35Explain event driven architecture in the context of System Design.
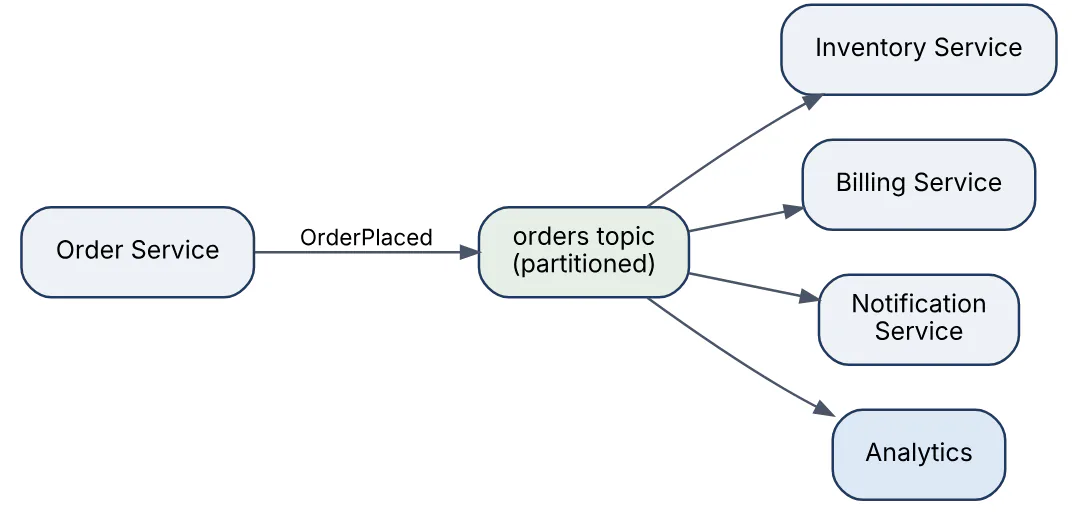
Event-driven architecture structures a system around the production and consumption of events, which are immutable records that something happened (OrderPlaced, PaymentCaptured). Producers publish events to a broker without knowing who consumes them; consumers subscribe to the events they care about. This decouples services in time (consumers may be down and catch up later) and in topology (new consumers can be added without changing producers).
Key elements:
- Broker. A log-based broker (Kafka-style) retains events in ordered partitions and lets many consumer groups read independently; a queue-based broker delivers each message to one consumer and deletes it.
- Event schema and versioning. Events are contracts; a schema registry and backward-compatible evolution prevent consumers breaking.
- Ordering. Guaranteed only within a partition, so events for one entity should share a partition key.
- Delivery semantics. Typically at-least-once, so consumers must be idempotent.
- Patterns. Event notification (thin event, consumer fetches details), event-carried state transfer (fat event, no callback), and event sourcing (the event log is the system of record and state is rebuilt by replay).
The cost is harder reasoning: there is no single call stack, workflows span services asynchronously, and debugging requires correlation IDs and tracing across the broker.
36In a real project using System Design, how would you apply, test, or troubleshoot event driven architecture?
Apply. Replacing synchronous calls between an order service and its five downstream consumers, I would publish OrderPlaced to a partitioned topic keyed by order ID through a transactional outbox, so the event is written in the same database transaction as the order and relayed by a separate process. Each consumer runs in its own consumer group, stores the last processed event ID per order to deduplicate, and uses a schema registry with backward-compatible evolution rules enforced in CI. Workflows needing a result (payment confirmation) emit a follow-up event rather than calling back.
Test. Contract tests validate every produced event against the registered schema and check that consumers tolerate added fields. Consumer tests replay a recorded stream including duplicates and out-of-order events for different orders, asserting final state is correct. End-to-end tests publish one event and wait for the expected downstream side effects with a timeout, which also measures propagation latency. Replay tests reset a consumer group’s offset and confirm reprocessing is harmless.
Troubleshoot. Consumer lag growing on one partition means a hot key or a slow consumer instance; partition-level lag metrics show which. A downstream service missing events usually traces to a consumer crash loop on a poison message, so each consumer needs a dead-letter topic and an alert. State inconsistencies between services after an incident are investigated with the correlation ID carried in every event header through the tracing system.
A primary consideration is that the outbox pattern, not direct publishing from application code, is what makes the event stream trustworthy; without it a crash between commit and publish silently loses events.
37Explain message queues retries in the context of System Design.
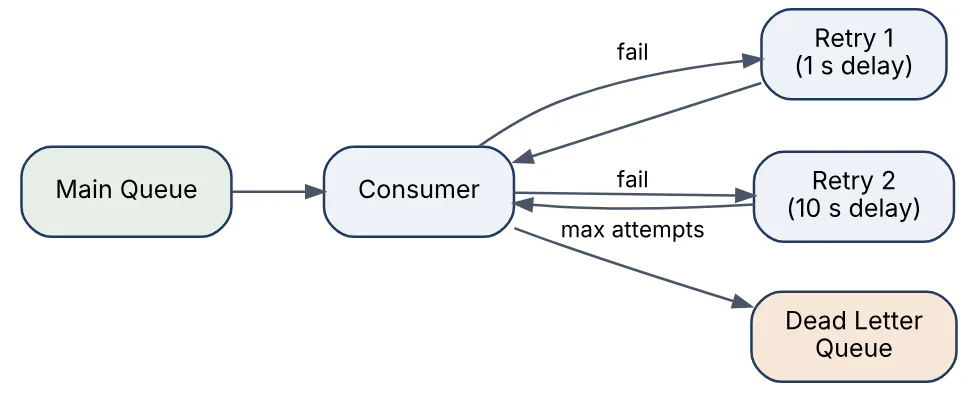
Retries in a message-queue system handle the case where a consumer fails to process a message, by making the message available again after a delay instead of losing it. The design goal is to recover from transient failures (a dependency timing out) without endlessly reprocessing permanent failures (a malformed payload) or overwhelming a struggling dependency.
Mechanics:
- Acknowledgement. A consumer acks a message only after successful processing. If it crashes or nacks, the broker redelivers after a visibility timeout. This gives at-least-once delivery.
- Backoff. Each retry waits longer (exponential backoff, for example 1 s, 2 s, 4 s, up to a cap) with random jitter so a fleet of consumers does not retry in lockstep.
- Retry limit and dead-letter queue. After N attempts the message moves to a dead-letter queue (DLQ) for inspection, alerting and manual or automated replay.
- Delay implementation. Brokers without native delayed delivery use a chain of retry queues with increasing TTLs or a scheduled re-enqueue.
- Idempotent consumers. Because a message may be redelivered after partial processing, handlers must detect duplicates, usually by storing processed message IDs.
- Poison-message isolation. A message that always fails should not block the partition; move it aside quickly if ordering allows.
Retries interact with ordering: redelivering one message later breaks strict order within a partition, so systems that need order must either stop the partition until the message succeeds or tolerate reordering.
38In a real project using System Design, how would you apply, test, or troubleshoot message queues retries?
Apply. For an order-fulfilment consumer calling a warehouse API, I would classify failures: timeouts and 5xx are retried with exponential backoff and jitter up to five attempts over about ten minutes; 4xx validation errors go straight to the DLQ because retrying cannot help. The handler records the message ID in the same transaction as its side effects, so a redelivery after a crash is recognised and skipped. A DLQ consumer posts to an alerting channel with the payload and failure reason, and an operator tool replays messages after a fix.
Test. Unit tests inject each failure class and assert the correct path (retry versus DLQ) and the backoff schedule. Integration tests kill the consumer between side effect and ack, then verify the redelivered message is deduplicated. Load tests make the downstream return errors for 30 seconds and confirm retries spread out (no synchronized spikes) and the queue drains afterwards without manual intervention. DLQ replay is tested as a first-class feature.
Troubleshoot. A queue draining slowly while consumers look idle usually means messages are cycling through retries, visible as a high redelivery count metric. Duplicate side effects (two shipments) point to the ID being recorded outside the transaction. A DLQ filling rapidly after a deploy is a schema or dependency change, and the DLQ reason distribution shows which. Messages vanishing without trace often turn out to be a retry limit of zero on a misconfigured queue.
One important consideration is that retries multiply load on an already failing dependency, so they must be paired with a circuit breaker that pauses consumption when the error rate crosses a threshold.
39Explain idempotent API design in the context of System Design.
An idempotent API operation produces the same result no matter how many times it is executed with the same input, so a client that times out can safely retry without causing duplicate side effects. This is the foundation of reliable communication over unreliable networks: a lost response is indistinguishable from a lost request, and only idempotency lets the client resolve that ambiguity by retrying.
HTTP semantics give a baseline: GET, PUT and DELETE are idempotent by definition (setting a resource to a state twice yields the same state), while POST generally is not. For non-idempotent operations such as “create a payment”, the standard technique is an idempotency key:
- The client generates a unique key (UUID) per logical operation and sends it in a header.
- The server checks a store for that key. If present, it returns the stored response without re-executing.
- If absent, it records the key with an in-progress marker, executes, stores the response and returns it.
- Keys expire after a window (often 24 hours).
Concurrency must be handled: two simultaneous requests with the same key should result in one execution, achieved with a unique constraint on the key or an atomic set-if-absent in the store. Keys should be scoped per client so different tenants cannot collide, and the request body is usually fingerprinted so reuse of a key with a different payload is rejected.
def create_payment(req, key, store, db):
    existing = store.get(key)
    if existing:
        return existing              # replay stored response
    if not store.set_if_absent(key, "IN_PROGRESS", ttl=86400):
        return conflict_409()        # concurrent duplicate
    resp = db.charge(req)            # the real side effect
    store.set(key, resp, ttl=86400)
return resp40In a real project using System Design, how would you apply, test, or troubleshoot idempotent API design?
Apply. On a wallet top-up endpoint I would require an Idempotency-Key header, reject requests without it, and store the key, a hash of the request body, the status and the serialised response in a table with a unique constraint on (client_id, key). The insert of the key and the ledger write happen in the same database transaction, so there is no window where the side effect exists without the key. Internally, service-to-service calls follow the same rule, with the upstream event or request ID used as the key, so retries from message redelivery are equally safe.
Test. Unit tests send the same request twice and assert one ledger entry and identical responses, including identical generated IDs. Concurrency tests fire 50 parallel requests with one key and assert exactly one execution and 49 replays or 409s. Mismatch tests reuse a key with a different body and expect 422. Fault-injection tests crash the service between the side effect and response, then retry and verify the stored response is returned, not a second charge.
Troubleshoot. Duplicate charges despite idempotency almost always come from the client generating a fresh key on retry, visible in logs as distinct keys with identical bodies seconds apart. Clients receiving a 409 forever indicate an in-progress marker left behind by a crash with no expiry.
Unexpected replays of stale responses after a data correction mean the key TTL is longer than the business expects.
The main consideration is that idempotency keys protect against duplicates of the same logical operation; they do not protect against a user legitimately clicking “pay” twice for two intentional orders, which is a UI and business-rule concern.
41Explain multi-region failover in the context of System Design.
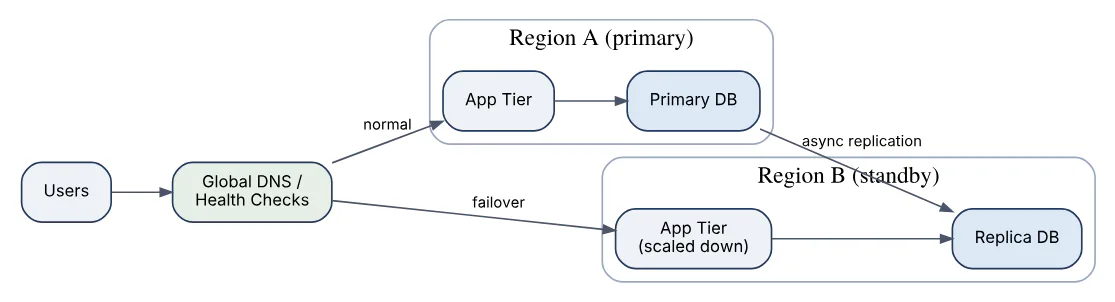
Multi-region failover keeps a service available when an entire cloud region becomes unreachable, by running the system in two or more geographically separate regions and redirecting traffic when one fails. The design is defined by how much data and capacity the standby region holds and how traffic is switched.
Deployment models, in increasing cost and decreasing recovery time:
| Model | Standby region | Typical RTO / RPO |
|---|---|---|
| Backup and restore | Only backups | Hours / hours |
| Pilot light | Data replicated, minimal compute | Tens of minutes / minutes |
| Warm standby | Scaled-down full stack | Minutes / seconds to minutes |
| Active-active | Full stack serving traffic | Seconds / near zero |
Key mechanisms:
- Traffic steering via DNS with health checks and low TTLs, or anycast/global load balancers that shift traffic faster than DNS caches allow.
- Data replication across regions, which is asynchronous in practice because of latency; the lag defines the recovery point objective (RPO).
- Failover decision: automated based on health signals, or manual to avoid flapping and split-brain. Failback is often harder than failover because the data must be reconciled.
- Stateful components (databases, queues, caches) need explicit per-component strategies; stateless services simply need capacity in both regions.
Active-active designs need a story for write conflicts, usually by partitioning users to a home region or using conflict-free data types.
42In a real project using System Design, how would you apply, test, or troubleshoot multi-region failover?
Apply. For a B2B invoicing platform with a stated one-hour RTO and five-minute RPO, I would run a warm standby: the full stack deployed in a second region at 20% capacity with autoscaling, database replicated asynchronously with lag alerting at two minutes, object storage replicated natively, and queues drained to a checkpoint before any switch. DNS health checks point at a synthetic transaction, not a ping. Failover is a documented runbook executed by a human with one command, since automated failover on a false alarm would cause more outages than it prevents at this tier. Secrets, certificates and configuration are deployed to both regions by the same pipeline so the standby never drifts.
Test. Quarterly game days fail over production for real during a low-traffic window, measure actual RTO and RPO, and fail back. Between game days, a weekly automated drill fails over the staging environment. Pre-flight checks compare deployed versions and configuration between regions daily. Capacity tests confirm the standby can autoscale to full load within the RTO.
Troubleshoot. A failover that “worked” but left users seeing errors usually means a hard-coded regional endpoint in some service, found by grepping configuration and traffic logs for the dead region. Data missing after failover is the replication lag at the moment of failure; reconciliation uses application logs or the primary’s recovered write-ahead log. Failback conflicts arise when the old primary accepted writes before it was fenced, which is why fencing the old region comes first in the runbook.
The important consideration is that an untested standby region is a liability, not insurance; drift accumulates silently until the day it is needed.
43Explain distributed transactions saga in the context of System Design.
A saga manages a business transaction that spans several services, each with its own database, by breaking it into a sequence of local transactions. Each step commits locally and publishes an event or message; if a later step fails, the saga runs compensating transactions that semantically undo the earlier steps. This replaces two-phase commit, which requires locks across services and a coordinator that becomes a bottleneck and availability risk.
Two coordination styles:
- Choreography. No central coordinator. Each service listens for events and reacts: Order emits
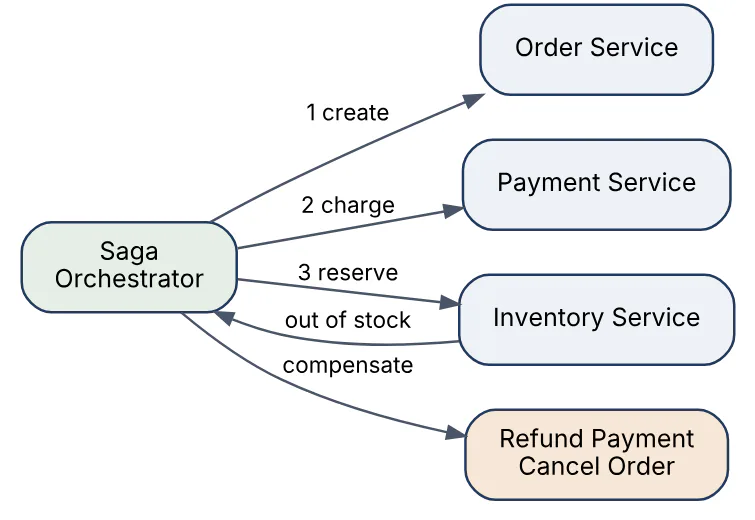
OrderCreated, Payment charges and emitsPaymentCompleted, Inventory reserves and emitsStockReserved. Simple for short flows, hard to follow and reason about as steps grow. - Orchestration. A saga orchestrator holds the workflow state and sends commands to each service, waiting for replies. The flow is explicit and visible in one place, at the cost of one more component.
Properties to understand:
- Sagas give atomicity (all steps or all compensated) but not isolation; other transactions can observe intermediate states, so designs use semantic locks (an order in
PENDINGstate) or commutative updates. - Compensations must be idempotent and must always be possible; steps that cannot be compensated (sending an email) go last.
- The orchestrator persists its state after every step so it can resume after a crash.
The orchestrated flow for an order is shown below, including the compensation path.
44In a real project using System Design, how would you apply, test, or troubleshoot distributed transactions saga?
Apply. For a travel booking that reserves a flight, a hotel and charges a card across three services, I would use an orchestrator backed by a durable workflow table, since the flow has branches and timeouts (hold expiry) that choreography makes opaque. Each step is a command with the saga ID as idempotency key; each reply is an event the orchestrator consumes. Steps are ordered so the hardest to compensate (charging the card) comes after the reservations are held. The orchestrator persists state transitions with the outbox pattern so a crash never leaves a step half-recorded.
Test. Unit tests on the orchestrator cover every path through the state machine, including failure at each step and compensation of all prior steps. Integration tests use stubbed services that can be told to fail, time out or reply twice, asserting the saga ends in a consistent terminal state and compensations run exactly once. A visualiser that renders the live state machine from the workflow table is part of the test tooling and later the operations tooling.
Troubleshoot. Sagas stuck in a non-terminal state for hours are found with a query on the workflow table; the cause is usually a lost reply, fixed by a timeout that re-sends the command. A compensation that itself fails (refund API down) needs its own retry with alerting, because it is the only route back to consistency. Customers seeing a “confirmed” hotel that is later cancelled is the lack of isolation showing through; the UI should present intermediate states as pending.
The key consideration is that sagas push complexity into business design: every step needs a defined compensation, and some compensations (undoing a sent email) are impossible and must be replaced with corrective follow-ups.
45Explain leader election in the context of System Design.
Leader election is the process by which a group of nodes agrees that exactly one of them is the leader responsible for a task that must not run concurrently, such as dispatching scheduled jobs, coordinating writes to a partition or holding a configuration lock. If the leader fails, the group must detect it and elect a replacement without ever having two leaders at once.
Approaches:
- Consensus-based. Protocols such as Raft or Paxos elect a leader by majority vote with monotonically increasing terms; a candidate needs votes from a quorum, so two leaders in the same term are impossible. Systems like etcd and ZooKeeper implement this and expose it to applications.
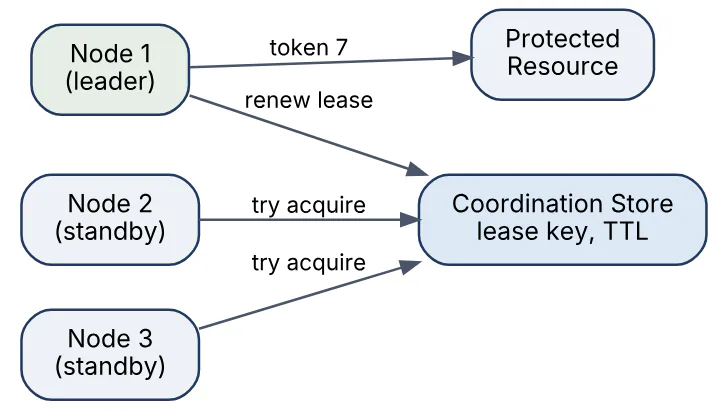
- Lease-based on a coordination store. Nodes compete to write a key with a TTL (an atomic set-if-absent). The winner renews the lease periodically; if it stops renewing, the key expires and another node acquires it. Simple, but correctness depends on the store’s own consistency and on bounded clock drift.
- Database-backed. A row with a version and expiry updated via compare-and-swap. Adequate for low-frequency elections.
Safety requirement: the old leader must stop acting before the new one starts. Leases achieve this by having the leader stop work when its lease has less than a safety margin remaining, and by fencing tokens: each election produces an increasing number, and downstream systems reject writes carrying an older token.
46In a real project using System Design, how would you apply, test, or troubleshoot leader election?
Apply. For a billing batch processor that must run on exactly one instance, I would use a lease in the existing coordination store (etcd or an equivalent) with a 15-second TTL renewed every 5 seconds. The leader performs work only while its lease is valid with at least 5 seconds of margin, and every write to the billing database includes the lease’s revision as a fencing token checked by a trigger that rejects stale tokens. Non-leaders stay warm, watching the key so they take over within seconds of expiry rather than polling.
Test. Integration tests run three instances, pause the leader’s process (SIGSTOP) to simulate a long GC pause, and assert a new leader is elected and the old one, on resume, discovers its lease is gone and stops without writing. Fencing tests force an old token through and verify the database rejects it. Network partition tests isolate the leader from the store and confirm it steps down even if it can still reach the database. Election churn under store latency is measured so timeouts are tuned, not guessed.
Troubleshoot. Duplicate billing runs mean two leaders overlapped; the fix is the safety margin plus fencing, and the logs will show the old leader renewing after expiry. No leader at all for extended periods indicates the store is unhealthy or the TTL is shorter than the renewal interval under load. Frequent leader changes usually trace to the renewal running on a thread that gets starved by the batch work itself.
The important consideration is that a lease alone cannot guarantee mutual exclusion against a paused process; only fencing at the resource makes it safe.
47Explain service discovery in the context of System Design.
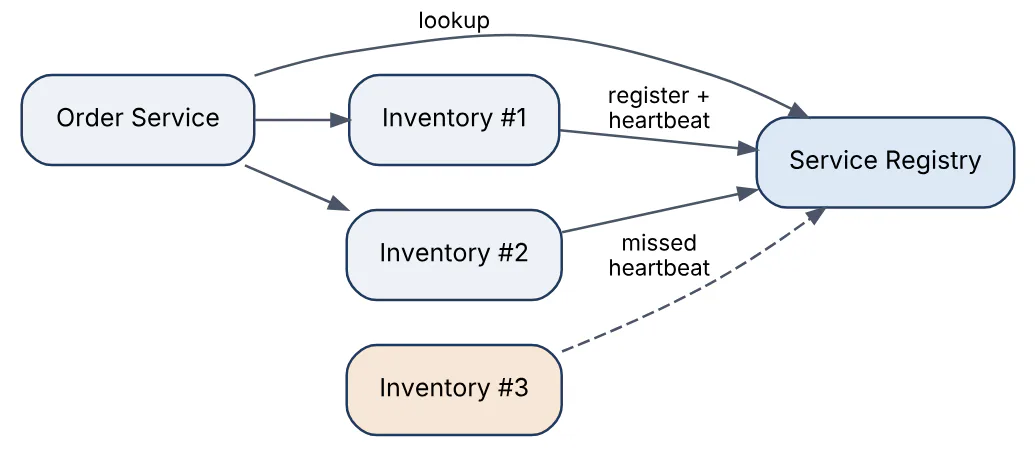
Service discovery lets services find the network locations of other services at runtime, instead of relying on hard-coded addresses, so instances can scale, move and fail without reconfiguration. Each instance registers itself (or is registered by the platform) in a registry with its address, port, health status and metadata, and clients query the registry to find healthy instances.
Two models:
- Client-side discovery. The client library queries the registry, caches results and load-balances across instances itself. Fewer hops and smarter balancing, but logic must exist in every language the organisation uses.
- Server-side discovery. The client calls a stable virtual address (a DNS name or a load balancer) and the infrastructure resolves it to a healthy instance. Simpler clients, one more hop, and the resolver must itself be highly available.
Registration can be self-registration (the instance calls the registry on startup and sends heartbeats) or third-party registration (an orchestrator such as Kubernetes registers pods as it schedules them). Health checking removes dead instances; a TTL on registrations guards against instances that die without deregistering.
In Kubernetes, discovery is built in: a Service object gets a DNS name and a virtual IP, and the platform maintains the endpoint list from pod readiness probes. Service meshes extend this with sidecar proxies that handle discovery, retries and mutual TLS transparently.
48In a real project using System Design, how would you apply, test, or troubleshoot service discovery?
Apply. In a Kubernetes-hosted platform I would rely on the built-in Service DNS for most calls and add readiness probes that check real dependencies, so an instance that cannot reach its database is withdrawn from endpoints before it fails requests. For calls crossing clusters or to legacy VMs, a dedicated registry (Consul or similar) with health checks and a DNS interface gives one lookup mechanism everywhere. Clients cache resolved endpoints for a short period and refresh asynchronously, so a registry outage degrades to slightly stale routing rather than total failure.
Test. Deployment tests roll a service and assert zero failed requests from callers, which validates the readiness-probe and deregistration timing. Failure tests kill an instance abruptly and measure how long callers keep sending to it; the target is under the health-check interval plus client cache TTL. Registry outage tests stop the registry and confirm existing traffic continues from cache. Metadata routing tests (version or zone tags) confirm clients honour them.
Troubleshoot. Intermittent connection refused errors right after deploys point to pods receiving traffic before readiness or after termination started; adding a pre-stop delay and fixing the probe resolves it. Traffic concentrating on a few instances often means clients cache DNS indefinitely (some runtimes do by default), so the JVM or language DNS TTL settings need review. Phantom instances in the registry indicate crashed processes without TTL-based expiry.
The consideration worth raising is that discovery and health checking define the blast radius of a bad deploy; a probe that passes trivially turns discovery into a way of routing traffic to broken instances.
49Explain observability SLIs SLOs in the context of System Design.
Observability is the ability to understand a system’s internal state from its external outputs, principally metrics, logs and traces. SLIs and SLOs turn that data into a shared definition of “working well enough”.
- A Service Level Indicator (SLI) is a measured ratio of good events to total events over a window: the fraction of requests served successfully, the fraction served under 300 ms, the fraction of data pipeline runs completed on time. Good SLIs are measured as close to the user as possible, ideally at the load balancer or client, not inside one service.
- A Service Level Objective (SLO) is the target for an SLI over a period, such as 99.9% of requests successful over 30 days. It is an internal engineering commitment, stricter than any contractual SLA, which carries penalties.
- The error budget is 100% minus the SLO: at 99.9% over 30 days that is about 43 minutes of full downtime, or proportionally more partial degradation. Spending the budget faster than planned triggers alerts and a policy response (freeze risky releases, prioritise reliability work).
Alerting on burn rate (how fast the budget is being consumed) at multiple windows gives fast detection of severe incidents and low noise for slow degradations, replacing threshold alerts on individual machines. Traces with a correlation ID link an SLI breach to the specific service and dependency responsible, and structured logs supply the detail.
Choosing a handful of user-facing SLIs per service, and reviewing the SLO periodically against real user expectations, is more valuable than instrumenting everything.
50In a real project using System Design, how would you apply, test, or troubleshoot observability SLIs SLOs?
Apply. For a checkout API I would define two SLIs at the edge load balancer: availability (non- 5xx responses / all responses) and latency (responses under 500 ms / all responses), each with a 99.9% SLO over 28 days. Every request carries a trace ID propagated to all services and included in structured logs, and each service exports RED metrics (rate, errors, duration) per endpoint and per dependency. Alerts fire on error-budget burn rate: a fast window (5 minutes at 14x burn) pages, a slow window (6 hours at 2x) opens a ticket. A dashboard shows remaining budget, and the release policy slows deploys when it dips below 25%.
Test. Synthetic probes exercise the checkout path continuously from several locations and are counted in the SLI so an outage with no real traffic still shows. Alert tests inject synthetic 5xx responses in staging and verify the page fires within the expected time. Trace tests assert that a sampled request produces spans in every hop with no orphaned spans. Dashboards are reviewed in incident retrospectives to check they would have shown the problem.
Troubleshoot. An SLO breach with all services reporting healthy usually means the SLI is measured too deep in the stack and the failure is at the edge or DNS. Noisy pages that resolve themselves point to too short a burn-rate window. Missing traces for the slowest requests indicate head-based sampling discarding exactly the interesting ones; tail-based sampling keeps them.
The important consideration is that an SLO nobody is willing to act on (freeze releases, re-prioritise) is a dashboard, not an objective.
51Explain authentication and SSO in the context of System Design.
Authentication establishes who a caller is; single sign-on (SSO) lets a user authenticate once with an identity provider (IdP) and access many independent applications without logging in again. In system design, this means moving credential handling out of individual services into a central IdP and having services trust tokens the IdP issues.
Standard protocols:
- OpenID Connect (OIDC) on top of OAuth 2.0 is the modern choice for web and mobile. The application redirects the user to the IdP, the IdP authenticates them (password, MFA, passkey) and returns an authorization code, which the application exchanges for an ID token (who the user is) and an access token (what they may call). The Authorization Code flow with PKCE is the recommended variant for browser and mobile clients.
- SAML 2.0 is the older XML-based protocol still dominant for enterprise SSO into SaaS products.
Design considerations:
- Token format and validation. Access tokens are usually JWTs signed by the IdP; services validate the signature against the IdP’s published keys (JWKS) locally, so no network call per request. Short lifetimes (minutes) limit the damage from leaked tokens; refresh tokens obtain new ones.
- Session management. The IdP keeps the SSO session; logging out everywhere requires front- or back-channel logout notifications to each application.
- Service-to-service calls use the client-credentials grant or mutual TLS rather than user tokens.
- Authorization (what the user may do) stays in each service or a policy engine; the IdP supplies identity and group claims, not fine-grained permissions.
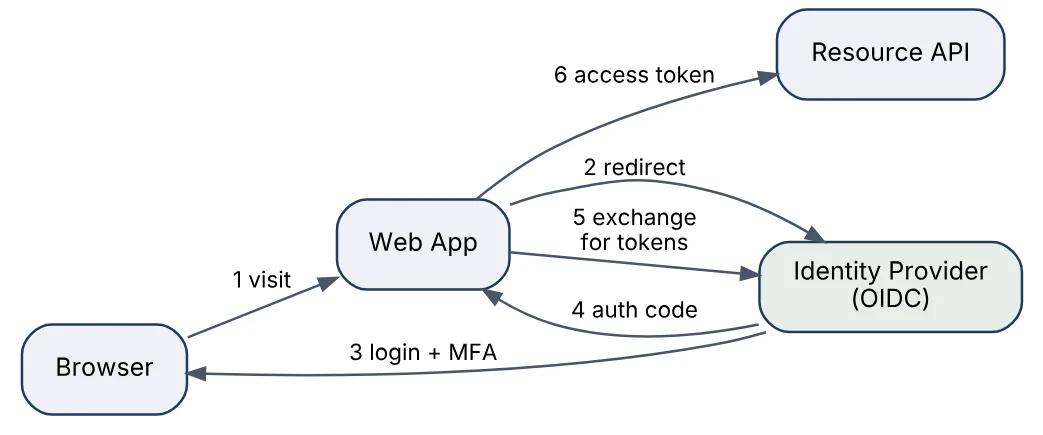
52In a real project using System Design, how would you apply, test, or troubleshoot authentication and SSO?
Apply. For an internal platform of a dozen web tools, I would stand up one IdP integrated with the corporate directory and enforce MFA there, so no application stores passwords. Each tool is registered as an OIDC client using Authorization Code with PKCE; backend APIs validate JWT access tokens at the gateway using cached JWKS and forward verified claims. Access tokens live 10 minutes, refresh tokens are rotated on each use and revoked on logout. Group claims from the directory drive coarse roles; fine-grained permissions stay in each application. Enterprise customers who insist on SAML federate into the same IdP, so applications never see protocol differences.
Test. Integration tests run the full redirect flow against a test IdP realm with scripted users, covering successful login, MFA challenge, expired session and consent revocation. Security tests check tokens with wrong audience, wrong issuer, expired exp, tampered signature and the none algorithm are all rejected. Logout tests confirm back-channel logout invalidates sessions in every registered application. Key rotation is rehearsed by rotating the IdP signing key in staging and verifying no authentication failures.
Troubleshoot. Users bounced in a redirect loop usually have a cookie domain or SameSite mismatch between application and IdP. Sudden mass 401s after an IdP deployment point to a key rotation with an overly long JWKS cache. “Logged out of one app but not another” is the expected consequence of missing logout propagation. Clock skew between servers causes tokens to be rejected as not-yet-valid, so a small leeway on nbf and iat checks is standard.
The main consideration is that centralising authentication makes the IdP the most critical dependency in the estate; its availability, backup and break-glass access deserve the same rigour as the primary database.
53Explain recommendation service in the context of System Design.
A recommendation service suggests items (products, videos, articles) a user is likely to want, by combining precomputed models with real-time context. Architecturally it separates offline training, near-line feature updates and an online serving path with a tight latency budget, typically under 100 ms.
- Offline. Batch jobs over interaction logs (views, purchases, ratings) train models: collaborative filtering (matrix factorisation or embedding models), content-based similarity, or deep learning rankers. Outputs are user and item embeddings and per-user candidate lists, written to a feature store and a low-latency key-value store.
- Near-line. Streaming jobs update features in minutes: what the user clicked in this session, trending items in the last hour.
- Online serving in two stages. Candidate generation retrieves a few hundred plausible items cheaply from several sources (similar-item neighbours via approximate nearest neighbour search, the user’s precomputed list, trending, editorial). Ranking scores candidates with a heavier model using fresh features, then applies business rules (diversity, exclude already purchased, inventory, sponsored slots).
- Feedback loop. Impressions and clicks are logged with the model version for training and for A/B evaluation.
Cold-start users fall back to popularity and contextual signals; cold-start items rely on content features. Caching the candidate stage per user for minutes cuts serving cost substantially while ranking stays fresh.

54In a real project using System Design, how would you apply, test, or troubleshoot recommendation service?
Apply. For a “customers also bought” widget on a product page, I would precompute item-to-item similarities nightly from co-purchase data and store the top 50 neighbours per item in a key-value store, serve candidates from that store merged with a session-based trending list, and rank with a lightweight model using the shopper’s session features from a stream. Business rules remove out-of-stock items and enforce category diversity. Every impression logs the model version and candidate source so experiments can be evaluated. The widget has a 80 ms budget and a static popularity fallback if any stage times out.
Test. Offline evaluation compares model versions on held-out data (precision at k, coverage) before any deployment. Shadow deployment runs the new model alongside the old, logging both outputs without showing them, to catch latency and error regressions. Online A/B tests measure click-through and add-to-cart rate with sufficient traffic for significance. Unit tests cover business rules exhaustively, since an excluded item appearing is a visible defect.
Troubleshoot. Recommendations becoming stale or repetitive usually mean the nightly job failed silently and the store holds old data; freshness metrics per key range expose it. Latency spikes often trace to the feature store under load or a ranking batch size that grew with candidate count. A sudden metric drop after a release is diagnosed with the logged model version and candidate source: a single bad source (trending list polluted by a bot) can degrade everything downstream.
The major consideration is feedback loops: a recommender trained on its own outputs amplifies popular items and narrows exposure, so exploration and diversity must be deliberate design choices.
55Explain web crawler design in the context of System Design.
A web crawler systematically downloads pages starting from seed URLs, extracts links, and continues until it has covered the desired scope, feeding content to an indexer or archive. Scale (billions of pages), politeness toward hosts and robustness against hostile or broken content drive the design.
Pipeline components:
- URL frontier. The queue of URLs to fetch, which encodes both priority (page importance, refresh frequency) and politeness (only one request to a host at a time, with a delay between requests). A common structure is a set of front queues by priority feeding back queues, one per host, with a heap ordering hosts by next-allowed-fetch time.
- Fetcher. Thousands of concurrent workers performing HTTP requests with timeouts, honouring
robots.txt(cached per host) and handling redirects. - DNS resolver cache, because DNS lookup becomes a bottleneck at crawl rates.
- Content processing. Parse HTML, extract links, normalise URLs (lowercase host, remove fragments, resolve relative paths), and detect duplicate content with hashes or shingling so mirrors are not re-indexed.
- URL seen store. A bloom filter or distributed set to avoid refetching; billions of URLs make this a memory-sizing exercise.
- Storage. Raw content in blob storage with metadata (fetch time, status, checksum) in a database.
Traps to handle: spider traps (infinitely generated URLs, calendar pages), extremely large pages, slow hosts, and link farms. Distributing the crawl by hashing hosts to crawler nodes keeps politeness state local to one node.
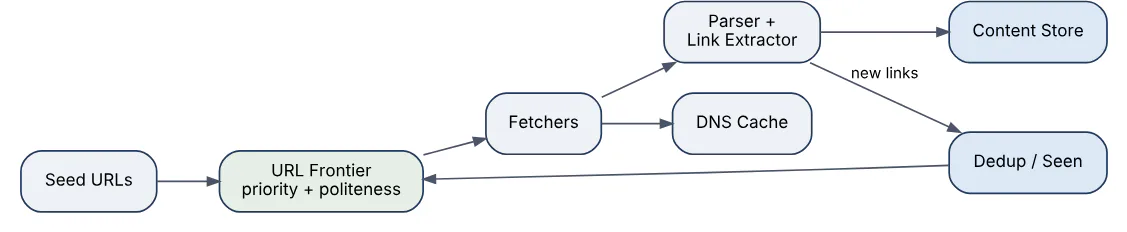
56In a real project using System Design, how would you apply, test, or troubleshoot web crawler design?
Apply. For a price-comparison crawler covering a few thousand retail sites, I would partition hosts across crawler nodes by hash, keep per-host politeness state (crawl delay from robots.txt or a default of several seconds) in each node’s memory, and prioritise URLs by how often their prices have changed historically. Fetched pages go to object storage, extracted product data to a queue for the parsing service, and URL metadata (last fetch, ETag, change frequency) to a database that drives re-crawl scheduling. Conditional requests with If-None-Match avoid downloading unchanged pages.
Test. Unit tests cover URL normalisation edge cases and robots.txt parsing against the specification’s examples. A local test web server simulates redirects, slow responses, malformed HTML, infinite pagination and 429 responses, asserting the crawler respects limits and escapes traps. Politeness tests assert the observed request interval per host never falls below the configured delay under full load. Throughput tests measure pages per second per node against a mirror.
Troubleshoot. A host blocking us is diagnosed from 403 / 429 rates per host and almost always means politeness state was lost after a restart or two nodes crawled the same host; persisting host assignments fixes it. The frontier growing without bound signals a spider trap, identified by hosts with URL counts far above their page count. Memory growth on nodes points to the seen-set outgrowing its bloom filter sizing, requiring a larger filter or tiered storage.
The important consideration is legal and ethical: terms of service, robots.txt and rate limits are constraints to design around, not obstacles to evade.
57Explain inventory and checkout in the context of System Design.
Inventory and checkout is the part of an e-commerce system that must never oversell while staying fast under bursts such as flash sales. The core difficulty is that stock is a shared, contended counter and checkout is a multi-step flow during which the user may abandon.
Design elements:
- Reservation, not decrement. When a shopper starts checkout, the system reserves units for a limited time (10–15 minutes) rather than decrementing stock. Payment success converts the reservation into a sale; expiry or cancellation releases it. Available stock = on hand − reserved − sold.
- Atomic reservation. The reserve step is a conditional update (
UPDATE stock SET reserved = reserved + n WHERE available >= n) or an atomic decrement in a cache with the database as source of truth. Optimistic concurrency with a version column handles moderate contention; a single-row hot item under flash-sale load may need per-item queuing or a dedicated in-memory counter with write-behind. - Checkout orchestration. Cart validation → reservation → payment authorisation → order creation → reservation confirmation, implemented as a saga so a payment failure releases the reservation.
- Idempotency on every step keyed by cart or order ID, since clients retry.
- Multi-warehouse inventory adds a sourcing decision: reserve against the location that will fulfil, with fallbacks.
Reads of “in stock” badges on product pages come from a cache updated by events and may be slightly stale; the authoritative check happens only at reservation.

58In a real project using System Design, how would you apply, test, or troubleshoot inventory and checkout?
Apply. For a flash-sale platform selling limited sneaker drops, I would hold the authoritative counter for each drop item in a database row but front it with an in-memory atomic counter per item that admits at most the available quantity into checkout; everyone else sees “sold out” instantly without touching the database. Admitted shoppers get a 10-minute reservation stored with an expiry index that a sweeper releases. Payment authorisation and order creation run as a saga keyed on the reservation ID, and the sweeper only releases reservations that are not mid-saga.
Test. The decisive test is a concurrency test: 10,000 simulated buyers hitting an item with 100 units must produce exactly 100 confirmed orders and zero oversells, repeated across many runs. Expiry tests advance the clock and verify released units become available. Saga tests fail payment at each stage and assert the reservation is released exactly once. Load tests replay a past drop’s traffic shape to size the admission tier.
Troubleshoot. Oversells after an incident are traced by reconciling reservations, orders and the counter; the usual cause is a failover restoring the in-memory counter from a stale snapshot, so the counter must be rebuilt from the database on start. Units stuck as reserved point to the sweeper lagging or a saga stuck mid-flight. Shoppers seeing “in stock” then “sold out” at checkout is expected behaviour from cached badges, but a large gap means the cache invalidation events are delayed.
The key consideration is that the admission counter is a deliberate single point of serialisation per item; it is fast because it is simple, and sharding it would reintroduce the oversell problem.
59Explain real-time collaborative editing in the context of System Design.
Real-time collaborative editing lets several users modify the same document simultaneously and see each other’s changes within milliseconds, with all replicas converging to the same content despite edits arriving in different orders. The hard problem is concurrency control without locking.
Two families of algorithms:
- Operational Transformation (OT). Edits are operations (insert “x” at position 5). When concurrent operations arrive, each is transformed against the others so that applying them in any order yields the same result. OT usually relies on a central server that serialises operations and transforms client operations against the history, which simplifies correctness. Google Docs uses this model.
- Conflict-free Replicated Data Types (CRDTs). Each character gets a unique, totally ordered identifier so inserts and deletes commute by construction and replicas merge without a central authority. Simpler to reason about and peer-to-peer friendly, at the cost of metadata overhead and tombstones for deleted characters.
Architecture around the algorithm:
- Clients hold a WebSocket to a collaboration server; documents are partitioned so all editors of one document reach the same server instance (or coordinate through a pub/sub channel).
- Operations are appended to a per-document log for persistence and late-joiner catch-up; periodic snapshots keep catch-up fast.
- Presence (cursors, selections) is broadcast as ephemeral messages, not persisted.
- Offline edits queue locally and are reconciled on reconnect, which is where CRDTs shine.
Version history is a by-product of the operation log.

60In a real project using System Design, how would you apply, test, or troubleshoot real-time collaborative editing?
Apply. Adding shared editing to a product-spec tool, I would use a mature CRDT library (Yjs or Automerge class) rather than implement OT, because the team needs offline support and a central transformer is a bottleneck we would have to engineer carefully. Documents route by consistent hash of document ID to a collaboration server; servers persist each update to an append-only log and write a snapshot every few hundred operations. Clients buffer edits locally and sync on reconnect. Awareness (cursors) travels on a separate ephemeral channel so it never bloats the log.
Test. Convergence tests generate random concurrent edit sequences on several simulated clients with arbitrary delivery order and partitions, then assert all replicas are byte-identical, run thousands of times under a fuzzer. Catch-up tests join a client to a document with a long history and measure load time, which validates snapshot frequency. Load tests put 50 active editors on one document to find the per-document throughput ceiling. Document size tests track CRDT metadata growth over months of edits.
Troubleshoot. Divergent documents (two users seeing different text) are a serious bug, usually a client applying an update twice or a library version mismatch; comparing the state vectors reported by each client locates the missing update. Growing memory per document indicates tombstone accumulation, resolved by periodic garbage collection when all known clients have synced. Cursor jitter traces to awareness updates being batched with document updates.
The important consideration is that CRDTs guarantee convergence, not intent preservation; two users editing the same word produce a merged result that is consistent but may be nonsense, so UI cues about who is editing where matter as much as the algorithm.
61Explain metrics ingestion pipeline in the context of System Design.
A metrics ingestion pipeline collects numeric time series (CPU, request latency, queue depth) from many sources, stores them efficiently and makes them queryable for dashboards and alerting with low latency. Volumes are high (millions of samples per second) and write-heavy, while queries are usually recent-range aggregations.
Stages:
- Collection. Agents or libraries expose metrics; the pipeline either pulls (scrapes an endpoint on an interval, as Prometheus does) or receives pushes (StatsD, OpenTelemetry). Pull simplifies discovery of what should exist; push suits short-lived jobs.
- Buffering. A message bus absorbs bursts and decouples collection from storage so a slow store does not drop samples.
- Aggregation and downsampling. Raw samples are kept for a short period at full resolution and rolled up to coarser intervals for long-term retention (for example 15 s for a week, 5 min for a year).
- Time-series storage. Columnar or specialised TSDB with compression that exploits timestamp regularity and small value deltas; series are identified by a metric name plus label set, indexed in an inverted index for label queries.
- Query layer that fans out across storage shards and time ranges and merges results; alert evaluation runs rules against the query layer on a schedule.
The main scaling hazard is cardinality: every unique label combination is a separate series, so a label like user ID or request ID explodes the index and memory. Cardinality limits and label allow-lists are essential controls.

62In a real project using System Design, how would you apply, test, or troubleshoot metrics ingestion pipeline?
Apply. For a platform of 500 services, I would run collectors per cluster that scrape service endpoints every 15 seconds, write to a message bus, and feed a horizontally sharded TSDB partitioned by hash of the series labels. Raw data is retained for 15 days; a downsampling job writes 5-minute rollups to object storage for two years. A cardinality guard in the collectors drops series whose labels match a denylist (anything that looks like an ID) and enforces a per-service series budget, with a metric about dropped series so teams see it. Alert rules evaluate against the recent shard only.
Test. Load tests push synthetic samples at twice expected peak and assert end-to-end ingestion lag stays under 30 seconds and no samples drop. Cardinality tests deliberately emit a high-cardinality label and verify the guard drops it and reports it. Query tests compare a rollup against the raw data it summarises. Failure tests kill a TSDB shard and confirm writes buffer in the bus and replay, with queries returning partial results flagged as such rather than failing.
Troubleshoot. Ingestion lag growing is first checked against bus consumer lag per partition; one hot partition means a label hash imbalance. TSDB memory climbing without traffic change is the cardinality signature, and the top series by label count identifies the offending service. Gaps in dashboards after a deploy usually mean a service renamed a metric or label, which a metric-name diff in CI would have caught.
A critical consideration is that the monitoring pipeline must not depend on the systems it monitors; its message bus, storage and alerting path need isolated infrastructure and an independent heartbeat alert.
63Explain logging system design in the context of System Design.
A logging system collects log events from every service and host, makes them searchable within seconds, retains them for compliance, and does so at volumes that make it one of the largest data pipelines in most organisations. Unlike metrics, logs are high-cardinality, variable-size text or structured records.
Pipeline design:
- Emission. Services write structured logs (JSON with timestamp, level, service, trace ID, message, fields) to stdout or a local file; never directly to the network, so a logging outage cannot block the application.
- Shipping. A per-host agent tails the files, batches, compresses and forwards to a message bus, with local buffering to disk to survive bus unavailability.
- Processing. Stream processors parse, enrich (add host, region, deployment), redact sensitive fields, and route by type: audit logs to immutable archive, debug logs to short-retention hot storage.
- Storage tiers. Hot tier: an inverted-index search engine for the last few days with full-text query. Warm tier: compressed columnar files in object storage queried by a scan engine for weeks to months. Cold archive for years, retrievable but slow.
- Query and alerting. A unified search interface across tiers, with alert rules on log patterns (error spikes, specific exceptions).
Cost control is central: sampling of repetitive debug lines, per-service volume quotas, dynamic log-level changes without redeploy, and short hot retention. Correlation with traces and metrics through shared trace IDs is what makes logs useful during incidents rather than just stored.

64In a real project using System Design, how would you apply, test, or troubleshoot logging system design?
Apply. For a fintech platform with regulatory retention requirements, I would mandate a structured logging library that injects trace ID, service and version into every line and forbids logging raw request bodies. Host agents ship to a bus; a processing tier redacts fields matching card and account patterns before anything is stored, routes audit events to write-once storage with a seven-year policy, and sends application logs to a search cluster with seven days of retention plus columnar object storage for 13 months. Each team has a daily volume quota with alerts at 80%.
Test. Redaction tests feed every known sensitive pattern through the processor and assert nothing leaks to any tier. Durability tests stop the bus for ten minutes under load and verify agents buffer to disk and no lines are lost after recovery. Query tests run representative incident searches against warm storage and assert they complete within the agreed time. Retention tests confirm audit records cannot be deleted or modified by anyone, including administrators, by attempting it.
Troubleshoot. Logs arriving minutes late point to agent backpressure, usually one service suddenly logging at debug level; per-service volume metrics identify it and a dynamic level change stops it. Search cluster instability often comes from a mapping explosion when services log arbitrary nested fields, fixed by limiting indexed fields. A missing trace in logs for a known request indicates the trace ID was not propagated across an async boundary, which a tracing audit finds.
The main consideration is that logs are where sensitive data leaks most often, and redaction at ingestion is a defence in depth, not a substitute for not logging it in the first place.
65Explain data lake design in the context of System Design.
A data lake stores large volumes of raw and processed data in open file formats on cheap object storage, decoupling storage from the compute engines that query it. It serves analytics, machine learning and reporting from one copy of the data instead of many warehouse-specific silos.
Layered structure (often called bronze, silver, gold or raw, cleaned, curated):
- Raw zone. Data landed as-is from sources (database change streams, application events, files from partners), immutable and partitioned by ingestion date. Nothing is lost, so any downstream mistake can be recomputed.
- Cleaned zone. Parsed, deduplicated, typed and conformed to standard schemas; stored in columnar formats (Parquet or ORC) partitioned by business keys such as event date.
- Curated zone. Aggregates and dimensional models built for specific consumers, optimised for query speed.
Supporting components:
- Table format (Apache Iceberg, Delta Lake or Apache Hudi) adds ACID transactions, schema evolution, time travel and efficient upserts on top of plain files, solving the classic lake problems of partial writes and small files.
- Catalog and metadata so engines discover tables, schemas and partitions, plus lineage and ownership.
- Ingestion by batch jobs and streaming change-data-capture.
- Governance: column-level access control, PII tagging, retention and deletion for privacy requests.
- Compute engines (Spark, Trino, warehouse engines) read the same files.
Compaction of small files, partition design matched to query patterns, and Z-ordering or clustering within files are the main performance levers.

66In a real project using System Design, how would you apply, test, or troubleshoot data lake design?
Apply. For a retailer consolidating sales, web analytics and supply-chain data, I would land everything into a raw zone on object storage via CDC for databases and a streaming sink for events, each dataset partitioned by ingestion date. Cleaned tables use Iceberg with partitioning by event date and a daily compaction job. A catalog records owner, schema, PII tags and SLA for every table; access is granted at the table or column level by group. Curated marts are rebuilt incrementally and expose stable views to BI tools, so schema changes in cleaned tables do not break dashboards.
Test. Data quality tests run as part of every pipeline: row counts against sources, null and uniqueness checks on keys, referential checks between facts and dimensions, and distribution checks that flag a day with suspiciously low revenue. Schema evolution tests add a column upstream and verify downstream jobs continue. Privacy tests run a deletion request end to end and confirm the subject’s rows vanish from every zone within the policy window. Time travel is tested by reproducing yesterday’s report from a snapshot.
Troubleshoot. Slow queries usually trace to small files (thousands per partition) or partitions misaligned with query filters; file statistics in the table metadata show both. A dashboard showing wrong numbers is traced upstream through lineage to the first zone where the quality check failed or was missing. Pipelines silently reprocessing all history indicate a lost watermark or checkpoint.
The important consideration is that a lake without a catalog, ownership and quality checks becomes a swamp of untrusted files; governance is part of the architecture, not an afterthought.
67Explain content delivery networks in the context of System Design.
A content delivery network (CDN) is a globally distributed set of edge servers that cache content close to users, so requests are served from a nearby point of presence (PoP) instead of travelling to the origin. This cuts latency, absorbs traffic spikes, offloads the origin, and provides a defensive layer against volumetric attacks.
How it works:
- DNS or anycast routing sends the user to the nearest healthy PoP.
- The edge checks its cache using a cache key (URL plus selected headers or query parameters). On a hit, it serves immediately; on a miss, it fetches from the origin (often through a regional shield cache to collapse many edge misses into one origin request), stores it according to
Cache-Controlheaders and serves it. - TLS terminates at the edge; connections to the origin are reused and kept warm.
What to cache:
- Static assets (images, scripts, video segments) with long TTLs and content-hashed filenames so a deploy changes the URL rather than needing invalidation.
- Semi-dynamic responses (product pages, API responses for anonymous users) with short TTLs and
stale-while-revalidateso users never wait for a refresh. - Personalised or authenticated content is usually bypassed, or cached per user with
Varyand signed URLs for private media.
Invalidation is by purge API (slow, eventually consistent across PoPs), by versioned URLs (instant, preferred), or by short TTL. Modern CDNs also run edge compute for redirects, header manipulation and A/B bucketing without an origin round trip.
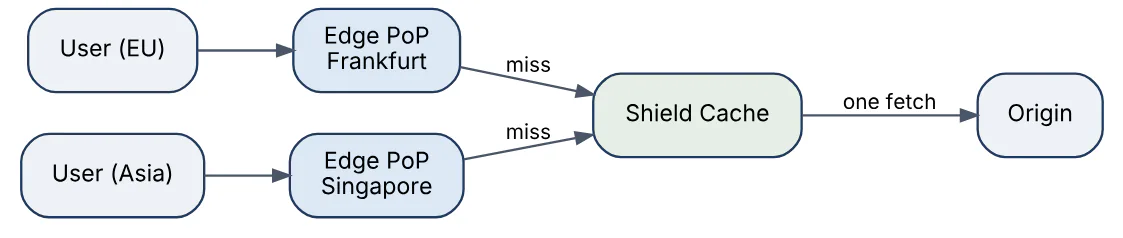
68In a real project using System Design, how would you apply, test, or troubleshoot content delivery networks?
Apply. For a global news site, I would serve all static assets through the CDN with one-year TTLs and content-hashed filenames, cache article HTML for anonymous readers for 60 seconds with stale-while-revalidate of five minutes, and bypass the cache for logged-in users via a cookie-based rule.
An origin shield in the origin’s region collapses misses. Breaking-news updates trigger a targeted purge of the article URL and the homepage. Images are resized at the edge from a single master, with the cache key including width and format. Origin access is restricted to CDN IP ranges and a shared secret header.
Test. Cache behaviour tests request each content type twice and assert the second response carries a cache-hit header and the correct Age. Purge tests measure propagation time across several PoPs. Vary tests confirm a logged-in cookie bypasses the cache and never contaminates the anonymous version. Load tests from multiple regions compare origin request rate to edge request rate to confirm the expected offload. Failover tests take the origin down and verify the edge serves stale content for the configured window.
Troubleshoot. A low hit ratio is almost always a cache-key problem: tracking query parameters, unnecessary Vary headers or Set-Cookie on cacheable responses; edge logs by key reveal it. Users seeing another user’s personalised page is the most serious failure and points to a missing bypass rule or a response cached despite a session cookie. Regional slowness with a healthy origin usually means a PoP’s shield path is congested, visible in per-PoP origin latency.
The vital consideration is that CDN caching of anything personalised must be treated as a security boundary; a single misconfigured rule leaks private data at scale.
69Explain distributed locks in the context of System Design.
A distributed lock lets processes on different machines agree that only one of them holds exclusive access to a resource at a time, for example to prevent two workers processing the same job or two instances running the same migration. Because the holder can crash or pause, every practical distributed lock is a lease: it expires unless renewed.
Implementations:
- Coordination service (ZooKeeper, etcd, Consul). Ephemeral or leased keys backed by a consensus protocol give the strongest guarantees; the lock disappears if the session ends, and a revision number serves as a fencing token.
- Single Redis instance.
SET key value NX PX ttlacquires; a Lua script releases only if the value matches. Fast and simple, but a primary failover can lose the lock state, so it is suitable only when occasionally having two holders is tolerable. - Redlock (majority of independent Redis nodes) attempts to improve on this but remains debated for correctness under clock drift and process pauses.
- Database row lock with
SELECT ... FOR UPDATEor an advisory lock, within a transaction. Correct and convenient when the work is already in that database.
Correctness checklist:
- Set the TTL atomically with acquisition.
- Release only your own lock (compare the token).
- Stop work before the lease expires, with a safety margin.
- Use a fencing token that increases on each acquisition and is checked by the resource, because a paused holder may resume after expiry and still believe it owns the lock.
Prefer idempotent operations and optimistic concurrency over locks where possible; locks add a coordination dependency to the request path.
70In a real project using System Design, how would you apply, test, or troubleshoot distributed locks?
Apply. To ensure that a nightly ledger-close job runs on exactly one of three scheduler instances, I would acquire a lease in etcd with a 30-second TTL and a keep-alive every 10 seconds, bind the job’s lifetime to the lease session, and write the lease revision into every ledger row the job touches; the database rejects writes whose revision is lower than the latest seen for that job type. For short critical sections such as “assign this support ticket” where a rare double-assignment is self-correcting, a Redis SET NX PX lock is acceptable and much cheaper.
Test. Mutual exclusion tests run many contenders and assert at any instant at most one believes it holds the lock, verified by having holders write to a shared log with timestamps. Pause tests SIGSTOP the holder beyond the TTL, resume it, and assert its subsequent writes are rejected by the fencing check. Crash tests kill the holder and measure time until another acquires. Release tests confirm a holder cannot release another’s lock after its own expired.
Troubleshoot. Two processes running the job simultaneously means either the TTL is shorter than a possible pause with no fencing, or a Redis failover lost the key; the lock store’s logs show which. Jobs never starting because the lock is “held” by a dead process points to a lease without session binding or a TTL set in a separate step that never executed. High lock-acquisition latency is usually the coordination store under load from being used for high-frequency locks it was not sized for.
The key consideration is that a lock without fencing at the resource is a hint, not a guarantee, and the design must state which it needs.
71Explain feature flag platform in the context of System Design.
A feature flag platform lets teams turn behaviour on or off, or vary it by user segment, at runtime without deploying code. It separates deployment (code is in production) from release (users see it), enabling gradual rollouts, kill switches, A/B experiments and trunk-based development.
Components:
- Flag definitions and rules in a control plane with a UI and API: flag key, variations (boolean or multivariate), targeting rules (by user attribute, percentage, environment) and an audit log of every change.
- SDKs embedded in services and clients. The SDK holds the full ruleset in memory and evaluates locally, so a flag check costs microseconds and does not depend on the network at request time.
- Distribution. SDKs receive updates by streaming (server-sent events) or polling, with a CDN or relay proxy in front for scale. If the control plane is down, SDKs keep serving the last known rules, and fall back to hard-coded defaults on first start.
- Percentage rollouts use a stable hash of flag key plus user ID, so a user stays in the same bucket as the percentage grows.
- Event pipeline records which variation each user saw, feeding experiment analysis.
Client-side flags (browsers, mobile) are visible to users, so targeting rules containing sensitive data should be evaluated server-side and only the result sent. Flags are technical debt: each needs an owner and removal date.

72In a real project using System Design, how would you apply, test, or troubleshoot feature flag platform?
Apply. To roll out a new pricing engine in a subscription product, I would wrap the call in a flag, release to internal staff first, then 1%, 10% and 50% of accounts with hash-based bucketing on account ID so the same customer always sees the same engine. A kill-switch flag falls back to the old engine instantly. Every flag is created with an owner, an expiry date and a ticket for removal, and a CI job fails when expired flags still exist in code.
Test. Unit tests cover both branches of each flag, plus the default when the SDK has no data. Evaluation tests assert bucketing is stable and approximately proportional across a large synthetic population. Resilience tests cut the SDK’s connection to the control plane and confirm the service continues with the last known rules and starts with defaults when cold. Rollout rehearsals in staging verify that a change propagates to all instances within the target seconds.
Troubleshoot. A customer reporting different behaviour than a colleague is diagnosed by evaluating the flag for their context in the platform’s debugger, which shows the matching rule and the attributes the SDK received; the usual cause is a missing or differently typed attribute. Incidents after a flag change are traced via the audit log, which should be one click from the alerting dashboard. Flag combinations that interact badly are a latent risk and are found by listing flags changed in the incident window.
The important consideration is that the flag system sits on every request path; its failure mode must be a safe default, never an outage or a surprise behaviour change.
73Explain microservices decomposition in the context of System Design.
Microservices decomposition is the process of splitting a system into independently deployable services, each owning a cohesive business capability and its own data. The aim is team autonomy and independent scaling and release, and the central skill is choosing boundaries that make that true rather than creating a distributed monolith.
Guidelines for drawing boundaries:
- Business capability or bounded context (Domain-Driven Design): order management, billing, catalogue, not technical layers such as “the database service”.
- Data ownership. Each service owns its data store and exposes it only through its API or events; shared databases couple services at the schema level.
- Change cohesion. Things that change together belong together. If most features need coordinated changes in three services, the boundaries are wrong.
- Team alignment. Boundaries should match team ownership (Conway’s law).
- Independent scaling and failure isolation justify separating components with very different load or reliability needs.
Migration approach for an existing monolith: the strangler fig pattern routes selected functionality to new services behind a facade, extracting one capability at a time starting with loosely coupled, high-change areas.
Costs are real: network failures, distributed transactions (sagas), eventual consistency, versioned contracts, and heavy operational tooling for deployment, tracing and discovery. A well-structured modular monolith is often the better starting point, with extraction driven by observed need.
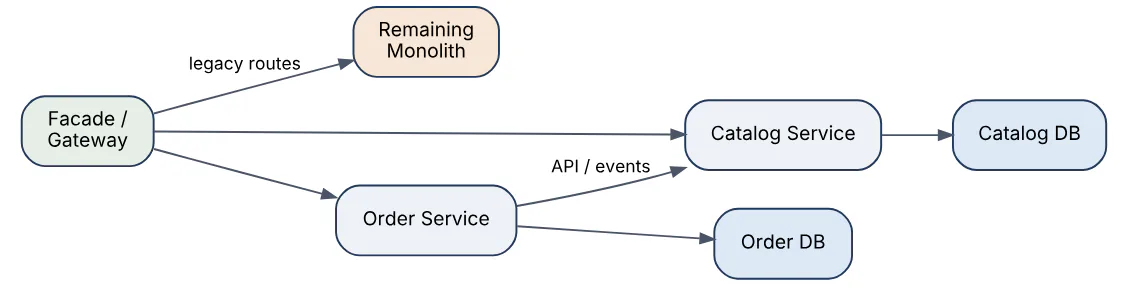
74In a real project using System Design, how would you apply, test, or troubleshoot microservices decomposition?
Apply. For a retail monolith slowing delivery, I would run event-storming workshops to find bounded contexts, then extract first the capability with the clearest boundary and the most frequent change, such as product catalogue, using a strangler facade. The new service gets its own database populated by change-data-capture from the monolith during transition, and the monolith’s catalogue code is deleted once traffic moves. Contracts between services are defined as versioned API schemas, and each service has a named owning team with its own pipeline and on-call rotation.
Test. Consumer-driven contract tests let each consumer publish expectations that the provider verifies in its pipeline, catching breaking changes before deployment. During extraction, a shadow-traffic comparison sends production reads to both the monolith and the new service and diffs responses. Failure tests make a dependency slow or unavailable to confirm timeouts, retries and fallbacks keep a calling service within its SLO. Deployment tests check that a service can be released alone without a coordinated release.
Troubleshoot. Telltale smells of wrong boundaries are lock-step deployments, chatty synchronous call chains (one user request fanning to eight services, visible in traces) and several services reading one table. The remedy is merging services, moving data ownership or replacing synchronous calls with events or locally cached copies. Cascading latency in a call chain is diagnosed with distributed traces and mitigated with timeouts, circuit breakers and bulkheads.
The consideration worth stating is that decomposition is reversible: merging two services that were split too finely is a legitimate and often correct move.
75Explain design tradeoffs availability latency in the context of System Design.
Availability and latency are linked quality attributes, and most design choices improve one at some cost to the other, or to consistency and cost. Availability is the fraction of time or requests that succeed; latency is how long a request takes, judged at percentiles (p50, p99) because tail latency is what users and dependent services feel.
Common tensions and their resolutions:
| Choice | Availability effect | Latency effect |
|---|---|---|
| Synchronous replication | Safer on failure | Adds cross-node round trip |
| Caching | Serves during backend outage | Faster, but stale data |
| Retries | Masks transient errors | Adds delay, can amplify load |
| Timeouts | Prevent hung calls | Too short causes false failures |
| Redundant (hedged) requests | Hides slow replicas | Extra load for lower tail latency |
Techniques that improve both together: replicating data close to users, graceful degradation (serve a cached or simplified response instead of an error), load shedding (reject excess work early so accepted work stays fast), and bulkheads that isolate a failing dependency.
Availability maths matters. Serial dependencies multiply: five components each at 99.9% yield about 99.5% end to end. Parallel redundancy improves it: two independent 99.9% replicas yield about 99.9999% if failures are independent, which shared dependencies often violate. A request touching several services also suffers tail amplification: if each call has a 1% chance of being slow, a call fan-out of 100 is slow most of the time.
The design discussion should name the SLO, identify which side the business values for each operation, and make the degraded mode explicit.
76In a real project using System Design, how would you apply, test, or troubleshoot design tradeoffs availability latency?
Apply. For a product-search API with a 99.95% availability and 300 ms p99 target, I would set per-dependency timeouts below the overall budget (for example 120 ms for the ranking service), allow a single retry only with a retry budget capping retries at 10% of traffic, and degrade to unpersonalised cached results when ranking fails. A concurrency limiter sheds excess load with fast 503s instead of queueing. Slow-replica tail latency is cut with hedged reads on the index tier, sent after the p95 latency elapses. Each degradation path is documented with the user-visible effect.
Test. Load tests at 1x, 2x and 3x expected peak confirm the system sheds load rather than collapsing, and that accepted-request latency stays within the target. Fault injection adds latency and errors to each dependency in turn, asserting the fallback engages and the SLO holds. Retry storm tests make a dependency fail for a minute and verify the retry budget prevents a feedback surge. Percentile dashboards are checked for p99 and p99.9, not just averages.
Troubleshoot. Rising p99 with flat p50 indicates tail issues: GC pauses, a slow replica, lock contention or a noisy neighbour; per-instance latency histograms isolate it. An outage that started as a slowdown is typically retries without budgets, queues without bounds or missing timeouts, found by examining request rates against a recovering dependency. Availability dips during deploys point to missing connection draining.
The principal consideration is that averages hide the experience that matters; every goal should be stated as a percentile and every fallback tested regularly, or it will not work when needed.
77Explain security and threat modeling in the context of System Design.
Threat modeling is a structured way to identify how a system could be attacked, and to decide mitigations, during design rather than after an incident. The process asks four questions: what are we building, what can go wrong, what will we do about it, and did we do a good job.
Steps:
- Model the system. Draw a data flow diagram with external actors, processes, data stores, data flows and trust boundaries (where data crosses between zones of different trust, such as internet to gateway or service to database).
- Enumerate threats at each element and boundary, commonly with STRIDE: Spoofing, Tampering, Repudiation, Information disclosure, Denial of service, Elevation of privilege.
- Rate and prioritise by likelihood and impact (DREAD-style scoring or a simple high/medium/low).
- Choose mitigations and record residual risk accepted by the owner.
Typical mitigations map to threats: strong authentication and mutual TLS against spoofing; signing, integrity checks and least-privilege writes against tampering; audit logs against repudiation; encryption in transit and at rest, plus data minimisation, against disclosure; rate limiting and autoscaling against denial of service; authorisation checks on every request and least privilege against escalation.
Defence in depth layers controls so no single failure is fatal: network segmentation, validated input, secrets in a vault with rotation, dependency scanning, and monitoring for abuse. Threat models are living documents, revisited when architecture, data sensitivity or exposure changes.

78In a real project using System Design, how would you apply, test, or troubleshoot security and threat modeling?
Apply. For a new patient-records API, I would run a threat modeling session with developers, a security engineer and the product owner at design time, drawing the data flow diagram with trust boundaries around the internet, the gateway, the services and the database. STRIDE across each flow yields a short list such as “a user could read another patient’s record by changing an ID” (elevation of privilege), mitigated by object-level authorisation checks in the service, not just at the gateway. Each mitigation becomes a ticket with an owner and is linked to the model, which is stored beside the code and updated whenever a trust boundary changes.
Test. Every mitigation gets a test: automated authorisation tests that attempt cross-tenant access with valid tokens, input fuzzing on public endpoints, static analysis and dependency scanning in CI, and infrastructure checks that storage is encrypted and not public. Before launch, an independent penetration test targets the highest-rated threats. Detection is tested too: simulated abuse (credential stuffing, enumeration) should trigger alerts.
Troubleshoot. When a vulnerability or incident arises, I trace it to the threat model: either the threat was missed (update the model and look for siblings of the flaw), or the mitigation was specified but implemented incorrectly or bypassed (fix and add a regression test). Investigation uses audit logs and access logs correlated by request ID to establish scope, with credentials rotated first if exposure is possible.
The important consideration is that a threat model is only valuable when it changes the design; a document produced for compliance and never revisited gives false assurance.
79Explain capacity planning and estimations in the context of System Design.
Capacity planning estimates the compute, storage, memory and network a system needs to meet its load and latency goals, now and over a planning horizon. In design discussions, back-of-envelope estimation validates that an architecture is feasible and reveals which resource is the bottleneck before anything is built.
Method:
- Start from users and behaviour. Daily active users times actions per user per day gives requests per day.
- Convert to rates. There are about 86,400 seconds in a day, so 10 million requests per day is roughly 115 per second on average. Peak is commonly 2–10 times average, so size for peak.
- Estimate data. Bytes per record times records per day times retention gives storage; multiply by the replication factor (typically 3) and add headroom.
- Estimate bandwidth. Requests per second times response size.
- Estimate memory for caches. Cache the hot fraction of the working set, for example the 20% of data serving 80% of reads.
- Derive server counts. Divide peak load by measured per-instance capacity at a safe utilisation (50–70%), then add redundancy for failure of a zone.
Useful reference numbers are order-of-magnitude only: memory access is on the order of 100 ns, an SSD random read about 100 microseconds, a round trip within a data centre about 0.5 ms, and cross-continent round trips 100 ms or more. Latency differences of orders of magnitude, not exact values, drive design choices.
Estimates should be stated with assumptions, rounded generously, and cross-checked against each other. Per-instance throughput must come from load tests, not guesses.
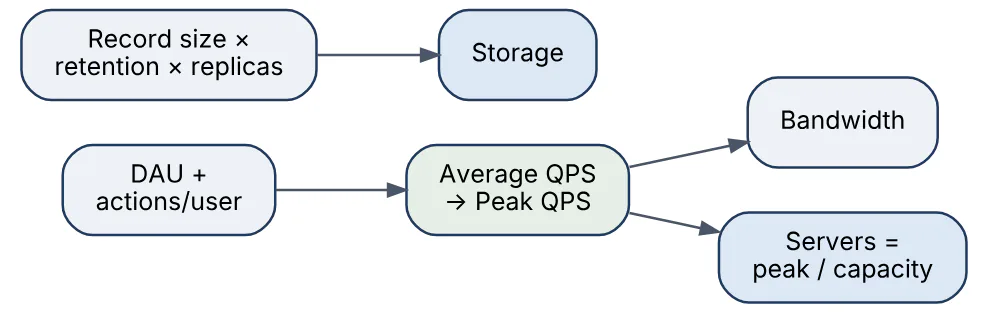
80In a real project using System Design, how would you apply, test, or troubleshoot capacity planning and estimations?
Apply. For a ticketing platform preparing for a major on-sale, I would begin with the expected number of simultaneous buyers from marketing and past events, convert to peak requests per second for each flow (browse, seat map, checkout), and size each tier from measured per-instance throughput at 60% utilisation, plus capacity for losing one availability zone. The database’s write ceiling for seat holds is usually the true limit, so I would estimate it separately and put a virtual waiting room in front to cap admitted users to what it can sustain. Quotas with the cloud provider are raised well ahead of time, since they are a common hidden limit.
Test. Load tests replay realistic traffic shapes, including the thundering herd at the on-sale moment, at 1x and 2x the forecast, and compare observed resource usage with the model; a gap of more than about 30% means an assumption is wrong. Soak tests reveal leaks and slow growth. Failure tests remove a zone during peak load. Results update the per-instance capacity figures, which the model depends on.
Troubleshoot. When production load deviates from the plan, I compare the actual traffic mix and per-request cost with the assumptions: usually one endpoint is much more expensive than modelled, or growth in a dimension (payload size, fan-out) was missed. Saturation is located with utilisation, queue length and error metrics for each resource in turn (CPU, memory, connections, disk, network). Short-term relief comes from scaling the bottleneck or shedding load; long-term, the model and forecast are corrected.
The important consideration is that capacity is a moving target: forecasts should be reviewed on a regular schedule against actuals, with headroom aligned to how fast the organisation can add capacity.
Answers tailored to your resume and job description
Add your resume and the job description in CrackItX's Settings. When the interviewer asks a System Design question, Claude suggests an answer using your real projects and the role's requirements, in real time.
See pricing →