Top 50 Node.js
interview questions
Event loop, streams, worker threads, Express and scaling. Open a question to read the answer.
01Explain Node.js runtime architecture in the context of Node.js.
Node.js is a single-threaded JavaScript runtime built on three layers: the V8 engine, which compiles and executes JavaScript; libuv, a C library that provides the event loop, a thread pool and cross-platform asynchronous I/O; and the Node core library (fs, net, http, crypto), written partly in JavaScript and partly in C++ bindings that bridge the two.
Application code runs on one main thread. Anything that would block, such as a file read, a DNS lookup or a crypto.pbkdf2 call, is handed to libuv. Network sockets use the OS notification mechanism (epoll, kqueue, IOCP) directly, so thousands of connections cost no extra threads. File system and CPU-heavy crypto calls are dispatched to libuv’s thread pool (4 threads by default, adjustable with UV_THREADPOOL_SIZE up to 1024). When work finishes, libuv queues the callback and the event loop runs it on the main thread.
This diagram shows how a request travels through the layers.

The practical consequence: Node excels at I/O-bound workloads with many concurrent connections and performs poorly when JavaScript itself hogs the CPU, because every callback waits behind it.
02In a real project using Node.js, how would you apply, test, or troubleshoot Node.js runtime architecture?
Apply. In an order API the architecture dictates the design: keep handlers non-blocking, push PDF invoice rendering and image resizing to worker threads or a separate job service, and size UV_THREADPOOL_SIZE (for example 16) when the service does heavy fs or crypto work alongside network I/O. Containers get one process per CPU core via cluster or the orchestrator rather than relying on a single thread.
Test. Load tests with autocannon at target concurrency compare p99 latency with and without the CPU work offloaded. A unit-level guard uses perf_hooks.monitorEventLoopDelay() in integration tests and fails if the mean loop delay exceeds, say, 20 ms during a request burst. Thread-pool saturation is tested by issuing 50 parallel fs.readFile calls and asserting the slowest completes within a bound.
Troubleshoot. The classic symptom is “the service is idle on CPU yet every request is slow”. node --cpu-prof or --inspect with the Chrome profiler reveals a synchronous hot spot such as JSON.parse on a 50 MB payload or a regex with catastrophic backtracking. If the profile is clean but fs latency is high, the thread pool is exhausted; raising UV_THREADPOOL_SIZE or moving the work out confirms it. process.memoryUsage() and heap snapshots separate GC pauses from loop blocking.
One recurring mistake is assuming async functions run in parallel threads; they only yield at await, so a CPU loop inside one still blocks everything.
03Explain event loop phases in the context of Node.js.
The event loop is libuv’s loop, and each iteration (“tick”) runs the following phases in a fixed order:
- timers – callbacks from
setTimeoutandsetIntervalwhose threshold has elapsed. - pending callbacks – I/O callbacks deferred from the previous iteration, such as certain TCP errors (
ECONNREFUSED). - idle, prepare – internal libuv housekeeping.
- poll – retrieves new I/O events and runs their callbacks (sockets, file reads). If nothing is pending and no timers are due, the loop blocks here waiting for I/O; if
setImmediatecallbacks exist, it does not block and moves on. - check –
setImmediatecallbacks. - close callbacks –
socket.on('close')and similar.
Between every callback, not just between phases, Node drains the process.nextTick queue and then the promise microtask queue (behaviour unified in Node 11, so Node 20 and 22 follow it).
setTimeout(() => console.log('timeout'), 0);
setImmediate(() => console.log('immediate'));
process.nextTick(() => console.log('nextTick'));
Promise.resolve().then(() => console.log('promise'));
// nextTick, promise, then timeout/immediate in
// non-deterministic order from the main module
Inside an I/O callback, setImmediate always fires before a zero-delay setTimeout, because the loop is in the poll phase and reaches check before the next timers phase.

04In a real project using Node.js, how would you apply, test, or troubleshoot event loop phases?
Apply. In a websocket notification service, phase knowledge drives three choices: use setImmediate rather than setTimeout(fn, 0) to yield between chunks of a large broadcast so pending socket I/O in poll is served first; never put long synchronous loops in timer callbacks because they delay every later phase; and schedule periodic housekeeping with setInterval while remembering its drift under load.
Test. An integration test wraps the server with perf_hooks.monitorEventLoopDelay({ resolution: 10 }) and asserts histogram.percentile(99) stays below a threshold under a simulated 5,000-client burst. Ordering-sensitive code (for example a flush that must run after all I/O callbacks for the current tick) is tested with deterministic sequences: inside an fs.readFile callback, assert setImmediate runs before setTimeout(0).
Troubleshoot. Symptom: timers fire late, health checks time out, yet CPU is moderate. node --trace-event-categories v8,node.async_hooks or Clinic.js Doctor shows a long poll-phase callback. A common cause is a JSON.stringify of a huge object inside a socket handler. The fix is to chunk the work with setImmediate or offload it to a worker thread. Another signature is setImmediate starvation when a process.nextTick recursion never lets the loop advance; --trace-uncaught and async stack traces pinpoint the recursive call.
Keep in mind that setTimeout(fn, 0) is really 1 ms, and timer ordering relative to setImmediate in the main module is not guaranteed, so never rely on it.
05Explain microtasks process.nextTick in the context of Node.js.
process.nextTick(fn) and promise reactions (.then, await continuations, queueMicrotask) both run before the event loop proceeds to its next callback, but they live in two separate queues with a strict priority: Node drains the entire nextTick queue first, then the entire microtask (promise) queue, and repeats until both are empty. Only then does control return to libuv.
Promise.resolve().then(() => console.log('promise 1'));
process.nextTick(() => console.log('tick 1'));
queueMicrotask(() => console.log('micro 1'));
process.nextTick(() => console.log('tick 2'));
// Output:
// tick 1
// tick 2
// promise 1
// micro 1
Key points:
nextTickis not part of the event loop phases; it runs “right after the current operation”, before any I/O or timer callback.- Its legitimate use is to emit an event or invoke a callback after the caller has finished the current synchronous code, for example letting a user attach listeners before an
EventEmitterfires. - Recursive
nextTickcalls starve the loop entirely because the queue is refilled before libuv regains control; recursivesetImmediatedoes not. - The Node documentation recommends
setImmediatefor deferral and reservingnextTickfor the API-consistency case above.
Interview takeaway: nextTick beats promises, promises beat everything in the loop, and neither should be used for CPU-heavy recursion.
06In a real project using Node.js, how would you apply, test, or troubleshoot microtasks process.nextTick?
Apply. In a custom database client, connect() returns an emitter synchronously but may already have a cached connection. Emitting ready with process.nextTick guarantees the caller’s .on('ready') registration runs first. In the same codebase, batch flushing of metrics uses a promise-based queueMicrotask so all increments made during one synchronous request handler are aggregated before the write is issued.
Test. Ordering tests in Vitest or node:test record output into an array and assert the exact sequence of nextTick, promise and timer callbacks. Emitter semantics are covered by a test that attaches the listener after calling connect() and expects it to fire exactly once. Starvation regressions are caught by a test that schedules setImmediate and fails if it has not run within 100 ms while the library performs its work.
Troubleshoot. The telltale symptom of nextTick abuse is a process that is 100% CPU and unresponsive to sockets with no obvious infinite loop. node --inspect with the CPU profiler shows a flat stack of processTicksAndRejections. Switching the recursion to setImmediate resolves it. A subtler bug is a swallowed promise rejection inside a microtask: since Node 15 unhandled rejections crash the process by default, so process.on('unhandledRejection') logging plus --unhandled-rejections=strict in CI catches the source.
The important caveat: from an await continuation, a nextTick queued inside still runs before the next promise reaction, which surprises engineers porting browser code where no such queue exists.
07Explain async callbacks promises in the context of Node.js.
Node offers three generations of asynchronous style built on the same event loop. Error-first callbacks (fn(err, result)) are the original core-library convention. Promises wrap a future value and chain with .then / .catch, with async / await as syntax sugar that makes promise code read sequentially. Core modules expose both: fs.readFile with a callback and fs/promises.readFile returning a promise; util.promisify converts any error-first API.
import { readFile } from 'node:fs/promises';
import { promisify } from 'node:util';
import { lookup } from 'node:dns';
const lookupAsync = promisify(lookup);

async function loadConfig(path) {
  try {
    const [raw, host] = await Promise.all([
      readFile(path, 'utf8'),
      lookupAsync('db.internal'),
    ]);
    return { ...JSON.parse(raw), dbAddress: host.address };
  } catch (err) {
    throw new Error(`config load failed: ${err.message}`, { cause: err });
  }
}
The crucial differences:
- A thrown error inside a callback is not caught by the caller’s
try; with promises it becomes a rejection you cancatch. - Callbacks may be invoked synchronously or twice by buggy code; a promise settles once.
Promise.allfails fast;Promise.allSettledwaits for all;Promise.raceandPromise.anyserve timeouts and fallbacks.awaityields to the event loop, so concurrency comes from starting promises before awaiting them.
Mixing styles is the main source of bugs: a callback API wrapped in new Promise must call resolve or reject on every path.
08In a real project using Node.js, how would you apply, test, or troubleshoot async callbacks promises?
Apply. A checkout service fetches cart, pricing and inventory in parallel with Promise.all, applies a 2-second budget with AbortSignal.timeout(2000) passed to fetch, and uses Promise.allSettled for non-critical enrichment (recommendations) so one slow dependency never fails the order. Legacy callback-based SDKs are wrapped once with util.promisify in an adapter module, so the rest of the codebase is uniformly async.
Test. Unit tests use node:test with mock.timers to fast-forward setTimeout based retries without waiting. Assertions use await assert.rejects(fn(), /timeout/) for failure paths. A lint rule (@typescript-eslint/no-floating-promises) runs in CI to catch un-awaited promises, which are the most common silent bug. Integration tests stub the inventory service with a delayed response to verify the timeout and the partial-result behaviour.
Troubleshoot. Symptoms include requests that never respond (a promise chain where one branch forgets to return) and UnhandledPromiseRejection crashes. Enabling --enable-source-maps and async stack traces (default in V8) makes the stack show the originating await. For “double callback” bugs from old SDKs, wrap with util.callbackify -aware guards or once. A leak of pending promises shows up as rising heap; a heap snapshot filtered on Promise objects points at the never-settled chain.
The trade-off to state: unbounded Promise.all over 10,000 items opens 10,000 concurrent operations; use a concurrency limiter such as p-limit or a batched loop.
09Explain streams and backpressure in the context of Node.js.
Streams process data incrementally instead of buffering it whole. Node has four base classes in node:stream: Readable, Writable, Duplex (both, like a TCP socket) and Transform (duplex with processing, like zlib.createGzip()). HTTP requests, responses, files and process stdio are all streams.
Backpressure is the mechanism that keeps a fast producer from overwhelming a slow consumer. Each writable has a highWaterMark (16 KiB for byte streams, 16 objects in object mode; Node 22 raised the default for byte streams to 64 KiB). writable.write(chunk) returns false once the internal buffer exceeds that mark; the producer should stop and resume on the 'drain' event. readable.pipe() and stream.pipeline() implement this handshake automatically.
import { pipeline } from 'node:stream/promises';
import { createReadStream, createWriteStream } from 'node:fs';
import { createGzip } from 'node:zlib';

await pipeline(
  createReadStream('access.log'),
  createGzip(),
  createWriteStream('access.log.gz'),
);
// memory stays flat regardless of file size
The pipeline below shows the backpressure signal flowing backwards against the data direction.

Why it matters: writing a 2 GB file to a slow socket with a plain write() loop grows the process heap to 2 GB and eventually crashes; pipeline keeps memory near the high-water mark. pipeline also propagates errors and destroys all streams on failure, which pipe() alone does not. Web Streams (ReadableStream) are available too and interoperate via Readable.fromWeb and Readable.toWeb.
10In a real project using Node.js, how would you apply, test, or troubleshoot streams and backpressure?
Apply. A reporting service exports multi-million-row CSVs: a Readable built from an async database cursor (Readable.from(cursorIterator)), a Transform that formats rows, and the HTTP response as the sink, joined with stream/promises.pipeline. File uploads to S3 are streamed from the request through a size-limiting Transform directly into the SDK’s upload, never touching disk. Object-mode streams with highWaterMark: 100 tune how many rows are in flight.
Test. Unit tests feed a Transform with Readable.from([...]) and collect output with stream.consumers.text() or for await. Backpressure tests use a deliberately slow Writable whose _write delays 10 ms and assert that readable.readableFlowing toggles and that process.memoryUsage().heapUsed stays bounded while 100 MB passes through. Error propagation is tested by making the middle stream throw and asserting pipeline rejects and the source emits 'close'.
Troubleshoot. Memory growth during exports means someone bypassed backpressure, typically res.write() in a for loop or source.on('data', chunk => dest.write(chunk)) without honouring the return value. Heap snapshots show large Buffer arrays queued on WritableState. Premature termination (ERR_STREAM_PREMATURE_CLOSE) usually means a client disconnected; handling it as a normal end rather than an error keeps logs clean. A stream that never ends is often a Transform whose _flush never calls its callback.
Remember that pipe() without pipeline leaves destination streams open on error, which leaks file descriptors.
11Explain buffers and binary data in the context of Node.js.
A Buffer is Node’s fixed-length sequence of raw bytes, implemented as a subclass of Uint8Array backed by memory allocated outside the V8 heap. It exists because JavaScript strings are UTF-16 and cannot represent arbitrary bytes; everything that crosses an I/O boundary (sockets, files, crypto, zlib) is a Buffer unless an encoding is specified.
const buf = Buffer.from('héllo', 'utf8');
console.log(buf.length);               // 6 (é is two bytes)
console.log(buf.toString('hex'));      // 68c3a96c6c6f
console.log(buf.toString('base64'));   // aMOpbGxv

const header = Buffer.alloc(8);        // zero-filled
header.writeUInt32BE(0xdeadbeef, 0);
header.writeUInt32LE(42, 4);
console.log(header.readUInt32BE(0).toString(16)); // deadbeef
Key points:
Buffer.alloc(n)zero-fills;Buffer.allocUnsafe(n)is faster but may contain old data, so never send it without fully overwriting it.- Encodings:
utf8(default),hex,base64,base64url,latin1,ucs2. buf.slice()andbuf.subarray()share memory with the original; copying requiresBuffer.copyBytesFromorBuffer.from(buf).- Typed arrays,
DataViewandArrayBufferinteroperate directly, which matters for WebAssembly and binary protocols. - Buffers count toward
process.memoryUsage().externalandarrayBuffers, notheapUsed.
String decoding across chunk boundaries can split a multibyte character; string_decoder.StringDecoder handles that correctly where chunk.toString() does not.
12In a real project using Node.js, how would you apply, test, or troubleshoot buffers and binary data?
Apply. In an IoT ingestion gateway, devices send a binary frame: 2-byte magic, 4-byte big-endian device ID, 2-byte length, payload and CRC16. A parser accumulates socket chunks into a Buffer, uses readUInt16BE / readUInt32BE at fixed offsets, validates the CRC and emits decoded objects. Image thumbnails are handled as Buffers passed to sharp, and signed URLs use crypto.createHmac('sha256', secret).update(buf).digest('base64url').
Test. Fixture frames are stored as hex strings and parsed with Buffer.from(hex, 'hex'). Tests cover a frame split across two chunks, two frames in one chunk, and a truncated frame, asserting the parser’s buffered state. Property-based tests (fast-check) generate random payloads and assert decode(encode(x)) round-trips. A dedicated test checks that Buffer.allocUnsafe is never used in code paths that write to the network, via a grep lint in CI.
Troubleshoot. Garbled text usually comes from chunk.toString() on a boundary that split a UTF-8 character; StringDecoder or TextDecoder with { stream: true } fixes it. Rising external memory with a flat heap points to retained Buffers, often small subarray views pinning large parent allocations in a cache; copying the small slice releases the parent. RangeError [ERR_OUT_OF_RANGE] on readUInt32BE means a length check was skipped before reading, a frequent fuzzing finding.
The main consideration: binary parsers are a security surface, so bound every length field before allocating or reading.
13Explain CommonJS versus ESM in the context of Node.js.
CommonJS (CJS) is Node’s original module system: require() and module.exports, loaded synchronously, with exports resolved at call time. ECMAScript modules (ESM) are the language standard: import / export, statically analysed, loaded asynchronously, with live bindings. Node selects the system by file extension (.cjs, .mjs) or the nearest package.json "type" field; the default without "type" is CommonJS.
| Aspect | CommonJS | ESM |
|---|---|---|
| Syntax | require, module.exports | import, export |
| Loading | Synchronous, dynamic paths allowed | Async, static graph, import() for dynamic |
| Bindings | Copied value at require time | Live bindings to exports |
| Scope helpers | __dirname, __filename, require | import.meta.url, import.meta.dirname (Node 20.11+) |
| Top-level await | Not available | Supported |
| Interop | require() of ESM: Node 22.12+ (sync, no TLA) | import of CJS works; named exports via static analysis |
// lib.cjs
module.exports = { total: (a, b) => a + b };

// app.mjs
import lib, { total } from './lib.cjs';   // default = module.exports
console.log(total(2, 3));                // 5
const { readFile } = await import('node:fs/promises');
ESM also enables tree-shaking in bundlers and strict mode by default. The practical pain is dual-package publishing: libraries ship both via the "exports" map with "import" and "require" conditions, and must avoid the “dual package hazard” of two copies of module state loading at once.
14In a real project using Node.js, how would you apply, test, or troubleshoot CommonJS versus ESM?
Apply. New services start as ESM: "type": "module" in package.json, .js files with import, and import.meta.dirname instead of __dirname. Legacy internal packages stay CJS and are consumed via import pkg from 'legacy' with destructuring afterwards, because named-export detection from CJS is heuristic. Shared libraries publish dual builds through an "exports" map with "import", "require" and "types" conditions generated by tsup or tsc with two configs.
Test. CI runs the test suite under both consumers for a dual package: one node:test project in .mjs and one in .cjs, plus publint and arethetypeswrong to validate the exports map and type resolution. A smoke test executes node -e "require('pkg')" and node --input-type=module -e "import 'pkg'" on the packed tarball, catching missing files and wrong extensions before release.
Troubleshoot. ERR_REQUIRE_ESM on Node 20 means a CJS file requires an ESM-only dependency; options are await import(), upgrading to Node 22.12+ where require(esm) works for modules without top-level await, or converting the consumer. ERR_MODULE_NOT_FOUND for ./utils in ESM is the mandatory-extension rule; add .js. ReferenceError: __dirname is not defined is the scope-helper gap. Jest and mocks in ESM are harder since module namespaces are immutable; dependency injection or vi.mock from Vitest replaces jest.mock hoisting.
The important trap is the dual package hazard: a singleton (such as a config store) loaded once as CJS and once as ESM yields two separate instances with diverging state.
15Explain Express middleware in the context of Node.js.
Middleware in Express is a function with the signature (req, res, next) that sits in a pipeline between the incoming request and the route handler. Each function can inspect or mutate req and res, end the response, or call next() to pass control to the next function in registration order. Error-handling middleware has four parameters (err, req, res, next) and is skipped unless an error is in flight.
import express from 'express';
const app = express();

app.use(express.json({ limit: '100kb' }));            // body parsing
app.use((req, res, next) => {                          // request logging
  const start = process.hrtime.bigint();
  res.on('finish', () => {
    const ms = Number(process.hrtime.bigint() - start) / 1e6;
    console.log(`${req.method} ${req.originalUrl} ${res.statusCode} ${ms}ms`);
  });
  next();
});
app.get('/orders/:id', authenticate, async (req, res, next) => {
  try { res.json(await orders.find(req.params.id)); }
  catch (err) { next(err); }
});
Key points:
- Order matters: a body parser registered after a route cannot help that route.
- Router-level middleware (
express.Router()) scopes behaviour to a path prefix. - Calling
next('route')skips remaining handlers for the current route. - In Express 4, a rejected promise in an async handler is not caught automatically and must be forwarded with
next(err); Express 5 (the default npm release since 2025) forwards rejections to error middleware itself. - Forgetting to call
next()or send a response leaves the request hanging until the client times out.
16In a real project using Node.js, how would you apply, test, or troubleshoot Express middleware?
Apply. A payments API composes a standard chain in one createApp() factory: helmet, request ID injection (crypto.randomUUID() stored in AsyncLocalStorage for logs), express.json with a strict limit, authentication, per-route validation middleware generated from Zod schemas, then routers mounted by version (/v1/payments). Authorization checks are expressed as parameterised middleware factories such as requireRole('finance') so routes read declaratively.
Test. Individual middleware is unit-tested by calling it with mock req / res objects and a next spy, asserting on status codes and whether next was called with an error. The whole chain is tested with supertest against the createApp() instance without binding a port, covering 401 for missing tokens, 413 for oversized bodies, and the presence of the request ID header on every response. Ordering regressions are caught by a test that posts JSON to a route and asserts req.body was parsed.
Troubleshoot. A request that never completes usually means a middleware path that neither responds nor calls next(); wrapping the server with a 30-second timeout middleware that logs the stalled route exposes it. ERR_HTTP_HEADERS_SENT indicates two handlers wrote a response, typically a missing return before res.json(). Latency spikes are localised by timing each middleware with res.on('finish') plus performance.mark, which once revealed a synchronous fs.readFileSync of a JWKS file on every request.
One consideration: app.use without a path matches every request including static assets, so place expensive middleware after the static handler.
17Explain HTTP request lifecycle in the context of Node.js.
An HTTP request in Node passes through libuv, the C++ parser (llhttp) and the JavaScript http module before any application code runs. The server socket accepts a TCP connection in the poll phase; bytes arrive on the socket and llhttp parses them incrementally. When headers are complete, Node creates IncomingMessage (a Readable) and ServerResponse (a Writable) and emits the 'request' event. The body is streamed afterwards in chunks; frameworks like Express consume it via body-parser middleware. The handler writes headers and body to the response; res.end() flushes and either closes the socket or returns it to the keep-alive pool.

Details that matter in production:
server.headersTimeout(60 s) andserver.requestTimeout(300 s) default to non-zero since Node 18 to defeat slowloris attacks;keepAliveTimeoutis 5 s.- The handler runs once headers arrive, so a large body may still be streaming while code executes.
- Node 20 and 22 ship
fetchandundicias the client side, with connection pooling per origin. - HTTP/2 is a separate
http2module with multiplexed streams per connection.
18In a real project using Node.js, how would you apply, test, or troubleshoot HTTP request lifecycle?
Apply. In a file-upload API, understanding that the handler fires before the body is complete lets the service reject on Content-Length immediately and stream accepted bodies into object storage rather than buffering. Keep-alive is tuned so server.keepAliveTimeout exceeds the load balancer’s idle timeout by a few seconds, avoiding 502s from the balancer reusing a socket Node just closed. AbortSignal from req (via req.on('close')) cancels downstream database queries when the client disconnects.
Test. supertest and raw node:http clients exercise edge cases: chunked bodies, Expect: 100-continue, a client that sends headers then stalls (asserting headersTimeout closes it), and a 10 MB body against a 1 MB limit expecting 413 before the body finishes. Load tests with autocannon -c 200 -d 30 validate keep-alive reuse by checking the OS socket count stays flat.
Troubleshoot. Intermittent ECONNRESET from an ALB points to the keep-alive mismatch above. ERR_HTTP_REQUEST_TIMEOUT floods come from slow mobile clients hitting requestTimeout; raising it only for the upload route is the fix. Sockets stuck in CLOSE_WAIT (ss -tan state close-wait) indicate the response was never ended on some path. NODE_DEBUG=http,net prints parser and socket events for a single reproduction.
A common mistake is reading req.body in a handler mounted before the body parser; the lifecycle makes the body available only after the stream is consumed.
19Explain REST API design in the context of Node.js.
REST design in Node is about expressing resources and operations through HTTP semantics and letting the framework (Express, Fastify, NestJS) map them to handlers. Resources are nouns in plural (/orders, /orders/{id}/items); HTTP methods carry the verb: GET reads (safe, cacheable), POST creates, PUT replaces, PATCH partially updates, DELETE removes. Status codes communicate outcome: 201 with a Location header on create, 204 for empty success, 400 for validation failures, 404, 409 for conflicts, 422 when syntax is fine but semantics are not, 429 for rate limits.
const router = express.Router();
router.get('/orders', async (req, res) => {
  const { cursor, limit = 20, status } = req.query;
  const page = await orders.list({ cursor, limit: Number(limit), status });
  res.json({ data: page.items, nextCursor: page.nextCursor });
});
router.post('/orders', async (req, res) => {
  const order = await orders.create(req.body, req.get('Idempotency-Key'));
  res.status(201).location(`/orders/${order.id}`).json(order);
});
Node-specific conventions worth stating:
- Cursor pagination over offset for large tables; filtering and sorting via query parameters.
- Versioning in the path (
/v1) or anAcceptheader; path versions are simplest to route. - A consistent error envelope, ideally RFC 9457 Problem Details (
application/problem+json). - Idempotency keys on
POSTfor payment-style operations. - OpenAPI as the contract, generated from code (Fastify schemas,
zod-to-openapi) or validated against it.
Statelessness means each request carries its own auth, so horizontal scaling needs no sticky sessions.
20In a real project using Node.js, how would you apply, test, or troubleshoot REST API design?
Apply. For an order-management platform the OpenAPI document is the source of truth, committed to the repo. Fastify routes declare JSON schemas for params, query, body and responses, which gives validation, serialization speed and documentation from one definition. Writes carry Idempotency-Key; the server stores the key with the response for 24 hours in Redis and replays it on retry. List endpoints return { data, nextCursor } and set Cache-Control and ETag so clients can use If-None-Match.
Test. Contract tests run the spec through schemathesis or Dredd, which generate requests from the OpenAPI document and flag undocumented status codes. supertest suites assert status codes, Location headers, and the problem-details error shape for every validation path. Consumer-driven contracts with Pact protect the mobile team from breaking changes. A CI step diffs the generated spec against the committed one and fails on unreviewed changes.
Troubleshoot. Clients reporting duplicate orders after network retries reveal a missing idempotency check on POST. A 200 with { error: ... } in the body breaks client retry logic and monitoring; API-wide error middleware fixes the status code. Slow list endpoints with ?page=5000 expose offset pagination; moving to cursors restores constant latency. Breaking changes slipping through are traced back to handlers that return extra fields, which response schemas in Fastify (with removeAdditional) stop at the source.
The consideration to voice: strict REST purity matters less than consistency; document the compromises (such as POST /orders/{id}/cancel for actions) and apply them uniformly.
21Explain error handling middleware in the context of Node.js.
Error-handling middleware in Express is any function declared with four arguments (err, req, res, next). Express identifies it by arity. When a handler calls next(err) or throws synchronously, Express skips all remaining regular middleware and routes and invokes the first error handler registered after that point. Because of this, error handlers are registered last, after all routes.
class HttpError extends Error {
  constructor(status, message, details) {
    super(message); this.status = status; this.details = details;
  }
}

app.use((req, res) => res.status(404).json({ title: 'Not Found' }));

app.use((err, req, res, next) => {
  if (res.headersSent) return next(err);   // let Express close the socket
  const status = err.status ?? 500;
  if (status >= 500) req.log.error({ err, requestId: req.id });
  res.status(status).type('application/problem+json').json({
    title: status >= 500 ? 'Internal Server Error' : err.message,
    status, details: err.details, requestId: req.id,
  });
});
Essential behaviours:
- Express 4 does not catch rejected promises from
asynchandlers; wrap them or useexpress-async-errors. Express 5 forwards rejections automatically. - Multiple error handlers chain via
next(err), allowing one for logging and one for formatting. - Check
res.headersSentto avoidERR_HTTP_HEADERS_SENT. - Never leak stack traces or internal messages for 5xx in production responses.
- Errors outside the request context (
uncaughtException,unhandledRejection) are not seen by middleware and need process-level handlers that log and exit.
22In a real project using Node.js, how would you apply, test, or troubleshoot error handling middleware?
Apply. A billing service defines a small error hierarchy (ValidationError 400, NotFoundError 404, ConflictError 409, UpstreamError 502) thrown from the domain layer, with a single error middleware that maps class to status and problem-details body. Database driver errors are translated at the repository boundary (23505 unique violation becomes ConflictError) so handlers never inspect driver codes. Each response carries the request ID that is also attached to the structured log line, and 5xx errors are reported to Sentry with the request context.
Test. Unit tests call the error middleware directly with each error class and a mock response, asserting status and that the body for a 500 contains no stack or driver message. supertest tests hit a route whose dependency is stubbed to throw and verify the mapped status, plus a test for an async handler rejection to prove the wrapper works. A test sets NODE_ENV=production and asserts the body differs from development mode.
Troubleshoot. A request that hangs after an error means next(err) was never called from a callback-style API; searching for catch blocks that only log finds it. Error responses arriving as HTML signals the error middleware is registered before a route or has only three parameters, so Express treats it as normal middleware. Duplicate Sentry events result from two error handlers both reporting; the logger handler should be the only one that reports and then forward with next(err).
The important caveat: swallowing errors to keep the process alive hides state corruption; crash and restart on programmer errors, respond gracefully only to operational ones.
23Explain JWT authentication in the context of Node.js.
A JSON Web Token is a signed, URL-safe string of three base64url parts, header.payload.signature, that lets a Node API authenticate requests without a session store. The server issues it after login; the client sends it as Authorization: Bearer <token>; middleware verifies the signature and expiry and attaches the claims to the request. Libraries are jsonwebtoken (callback/sync, mature) and jose (standards-complete, ESM, supports JWKS and Web Crypto).
import { SignJWT, jwtVerify } from 'jose';
const key = new TextEncoder().encode(process.env.JWT_SECRET);

export async function issue(user) {
  return new SignJWT({ sub: user.id, role: user.role })
    .setProtectedHeader({ alg: 'HS256' })
    .setIssuer('orders-api').setAudience('web')
    .setExpirationTime('15m').sign(key);
}

export async function authenticate(req, res, next) {
  const token = req.headers.authorization?.split(' ')[1];
  try {
    const { payload } = await jwtVerify(token ?? '', key,
      { issuer: 'orders-api', audience: 'web' });
    req.user = payload; next();
  } catch { res.status(401).json({ title: 'Unauthorized' }); }
}
Design rules:
- Short-lived access tokens (5–15 minutes) plus a rotating refresh token stored in an
HttpOnlycookie. - Pin the algorithm on verification; never accept
alg: noneor trust the header’s algorithm choice. - Prefer asymmetric
RS256/ES256when multiple services verify, publishing the public key via JWKS. - Validate
iss,audandexp; keep the payload free of sensitive data since it is only encoded, not encrypted.
The flow below shows where the token is issued and where it is verified.
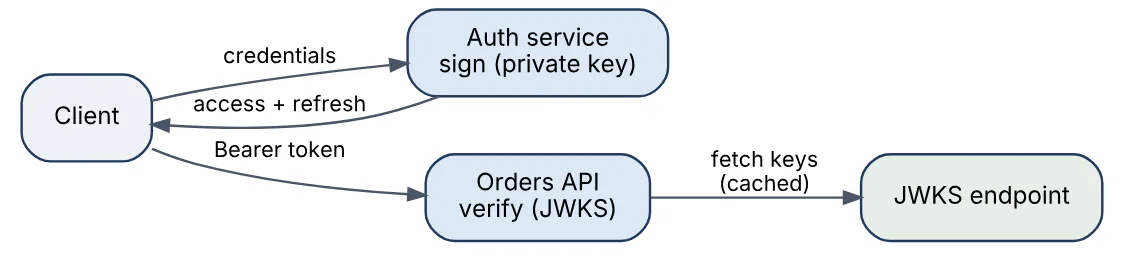
Revocation is the weak point: a signed token stays valid until expiry unless a denylist or short lifetime limits the damage.
24In a real project using Node.js, how would you apply, test, or troubleshoot JWT authentication?
Apply. In a multi-service platform, an auth service issues ES256 access tokens (10-minute lifetime) and refresh tokens persisted in Postgres with a family ID for rotation detection. Downstream services verify with jose.createRemoteJWKSet, caching keys and honouring kid so key rotation needs no redeploy. Authorization claims stay coarse (role, tenantId); fine-grained permissions are looked up per request. Refresh tokens live in HttpOnly; Secure; SameSite=Strict cookies scoped to /auth/refresh.
Test. Unit tests generate tokens with a test key pair and cover: expired token (401), wrong audience, tampered payload, alg switched to HS256 with the public key as secret (the classic confusion attack), and a token signed by a retired kid. Refresh rotation tests reuse an old refresh token and expect the whole family to be revoked. supertest integration tests hit protected routes with and without the Bearer header. Clock skew tests set clockTolerance and verify behaviour at the boundary.
Troubleshoot. A burst of 401s shortly after a deploy usually means the JWKS cache has not picked up a rotated key or the issuer URL changed; logging the kid from the failing token confirms it. Users logged out at odd intervals point to a mismatch between token exp and the client’s refresh timing or to servers with skewed clocks (check NTP). Oversized headers (431) appear when teams stuff permissions into the token; moving them server-side resolves it.
The key consideration is that JWTs trade revocation for statelessness, so pair short lifetimes with a Redis denylist for logout-everywhere requirements.
25Explain sessions cookies and CSRF in the context of Node.js.
Server-side sessions keep user state on the server and give the browser only an opaque session ID in a cookie. In Node this is typically express-session with a store such as connect-redis; the cookie should be HttpOnly (no JavaScript access), Secure (HTTPS only), SameSite=Lax or Strict, and signed so IDs cannot be forged.
Cross-Site Request Forgery exploits the fact that browsers attach cookies automatically: a malicious page submits a form to https://bank.example/transfer and the victim’s session cookie rides along. Defences in Node:
SameSite=Lax(the browser default now) blocks cookies on cross-sitePOSTs;Strictalso blocks top-level navigation from other sites.- Synchroniser tokens: the server embeds a per-session random token in forms and verifies it on state-changing requests (
csrf-csrfor@fastify/csrf-protection; the oldcsurfpackage is deprecated). - Checking
Origin/Sec-Fetch-Siteheaders on mutations. - Using
Authorizationheaders (JWT) instead of cookies removes CSRF but introduces XSS exposure if tokens sit inlocalStorage.
app.use(session({
  store: new RedisStore({ client: redis }),
  secret: process.env.SESSION_SECRET,
  name: 'sid', resave: false, saveUninitialized: false,
  cookie: { httpOnly: true, secure: true, sameSite: 'lax',
            maxAge: 30 * 60 * 1000 },
}));
Sessions suit server-rendered apps and allow immediate revocation; JWTs suit APIs consumed by multiple clients. Many systems use both: a session cookie for the browser and a token for mobile.
26In a real project using Node.js, how would you apply, test, or troubleshoot sessions cookies and CSRF?
Apply. A server-rendered admin portal uses express-session backed by Redis with a 30-minute rolling expiry, regenerates the session ID on login (req.session.regenerate) to defeat fixation, and sets SameSite=Strict. Every HTML form includes a CSRF token from csrf-csrf using the double-submit cookie pattern, and the API accepts mutations only with that token or a valid Sec-Fetch-Site: same-origin header. Logout destroys the server record, which immediately invalidates the cookie everywhere.
Test. supertest with an agent that persists cookies logs in, then asserts: a POST without the CSRF token returns 403, with it returns 200; the Set-Cookie header contains HttpOnly; Secure; SameSite=Strict; the session ID changes after login; and a request after logout is 401. A Playwright test from a different origin attempts a cross-site form post and confirms it is rejected. OWASP ZAP in CI scans for missing cookie flags.
Troubleshoot. Users logged out randomly in a multi-instance deployment means sessions are in the default MemoryStore; moving to Redis fixes it and removes the memory leak that store causes. secure: true cookies not being set behind a reverse proxy is the missing app.set('trust proxy', 1). CSRF 403s after a frontend deploy often come from the SPA sending the token in a header the server no longer reads. Redis session count growing without bound points to saveUninitialized: true creating a record per crawler hit.
One consideration: SameSite alone is not a complete CSRF defence for GET endpoints that mutate state, so never mutate on GET.
27Explain CORS and headers in the context of Node.js.
Cross-Origin Resource Sharing is the browser mechanism that decides whether JavaScript on https://app.example may read a response from https://api.example. The browser enforces it; the Node server merely declares policy through response headers. Simple requests (GET, POST with form content types, no custom headers) are sent directly and the browser checks Access-Control-Allow-Origin on the response. Anything else (JSON bodies, Authorization headers, PUT / DELETE) triggers a preflight OPTIONS request, and the server must answer with the allowed methods, headers and max-age before the real request is sent.
import cors from 'cors';
const allowed = new Set(['https://app.example', 'https://admin.example']);
app.use(cors({
  origin: (origin, cb) => cb(null, !origin || allowed.has(origin)),
  credentials: true,                       // allows cookies
  allowedHeaders: ['Content-Type', 'Authorization'],
  exposedHeaders: ['X-Request-Id'],
  maxAge: 600,                             // cache preflight 10 min
}));
Rules that trip people up:
Access-Control-Allow-Origin: *cannot be combined withcredentials: true; echo the specific origin and addVary: Origin.- Custom response headers are invisible to the client unless listed in
Access-Control-Expose-Headers. - CORS protects browsers only;
curlignores it, so it is not an authorization layer. - Security headers belong alongside it:
helmetsetsContent-Security-Policy,Strict-Transport-Security,X-Content-Type-Options: nosniffand removesX-Powered-By.
Fastify uses @fastify/cors with the same options; raw node:http requires setting the headers manually and short-circuiting OPTIONS with 204.
28In a real project using Node.js, how would you apply, test, or troubleshoot CORS and headers?
Apply. A public API with a first-party SPA and third-party integrators uses two policies: the SPA origins are allowed with credentials for cookie-based refresh, while /public/v1 responds with Access-Control-Allow-Origin: * and no credentials. Allowed origins come from configuration per environment, never a regex that matches app.example.evil.com. helmet applies CSP with nonces generated per request, and Cache-Control: no-store is set on authenticated responses so proxies cannot leak them.
Test. supertest sends an OPTIONS preflight with Origin and Access-Control-Request-Method: PUT and asserts the 204 and the exact allow headers; another test sends a disallowed origin and asserts the header is absent. Snapshot tests on the full response header set for a representative route catch accidental removal of Strict-Transport-Security. A Playwright test loads the real frontend against a staging API, since only a browser truly enforces CORS. securityheaders.com -style checks run via an npm script in CI.
Troubleshoot. The browser error “No ‘Access-Control-Allow-Origin’ header” on a 500 means the error path bypassed the CORS middleware; registering cors() before everything and before the error handler fixes it. Preflights failing with 401 come from auth middleware running on OPTIONS; skip authentication for that method. “Credentials flag is true but Allow-Origin is *” is the wildcard conflict.
Missing custom headers in fetch responses are the exposedHeaders omission. When the API sits behind a gateway that also adds CORS headers, duplicated values break the browser; the policy must live in exactly one layer.
The consideration: CORS misconfiguration that reflects any origin with credentials is effectively an authentication bypass for logged-in users.
29Explain input validation in the context of Node.js.
Input validation in a Node service means rejecting any request whose shape, types, ranges or formats differ from the contract before business logic touches it. Because JavaScript is dynamically typed and req.body is untrusted JSON, validation is also the primary defence against injection, prototype pollution and mass assignment. The dominant libraries are Zod (TypeScript-first, infers static types from the schema), Joi (mature, expressive), and JSON Schema via Ajv, which Fastify uses natively and compiles to fast validators.
import { z } from 'zod';

const CreateOrder = z.object({
  customerId: z.string().uuid(),
  items: z.array(z.object({
    sku: z.string().regex(/^[A-Z0-9-]{4,20}$/),
    qty: z.number().int().min(1).max(999),
  })).min(1).max(50),
  note: z.string().trim().max(500).optional(),
}).strict();                                  // reject unknown keys

type CreateOrder = z.infer<typeof CreateOrder>;

const validate = (schema) => (req, res, next) => {
  const result = schema.safeParse(req.body);
  if (!result.success) return res.status(400).json({
    title: 'Validation failed', errors: result.error.flatten() });
  req.body = result.data; next();            // use the parsed copy
};
Principles:
- Validate at the boundary (HTTP, queue consumer, CLI) and trust types inside.
- Allowlist fields; strip or reject unknown ones to stop mass assignment.
- Bound everything: string lengths, array sizes, numeric ranges, body size (
express.json({ limit })). - Validate query and path parameters too; they arrive as strings and need coercion.
- Validation is not sanitisation; output encoding for HTML and parameterised queries remain necessary.
30In a real project using Node.js, how would you apply, test, or troubleshoot input validation?
Apply. A customer-facing orders API keeps one Zod schema per endpoint in a contracts package shared with the frontend, so client forms and server validation cannot drift. Schemas are converted to OpenAPI with zod-to-openapi for documentation. Queue consumers validate every message payload with the same library, because messages from older producers are as untrusted as HTTP input. Environment variables are validated at boot with a schema so a missing DATABASE_URL fails fast instead of at the first query.
Test. Each schema has table-driven unit tests: valid payload, each required field missing, boundary values (qty: 0, qty: 1000, 51 items), wrong types, and unknown keys. Fuzz tests with fast-check feed arbitrary JSON and assert the validator never throws, only returns a failure. supertest tests check the 400 body shape so frontend error mapping stays stable. A CI check compares the generated OpenAPI against the committed version.
Troubleshoot. Reports of “the API accepts negative quantities” trace to a route that bypassed the validate middleware or read req.body before reassignment with the parsed copy. Prototype pollution ({"__proto__": {"isAdmin": true}}) is blocked by .strict() schemas and by JSON.parse already not invoking setters, but merging into objects with lodash merge must still be audited. Latency regressions after adding validation often come from z.string().email() on large arrays or recompiling Ajv schemas per request; compile once at module load.
A common mistake is validating only the body and forgetting req.query, where ?limit=1e9 or ?id[]= arrays arrive from qs parsing.
31Explain SQL injection and NoSQL injection in the context of Node.js.
Injection happens when untrusted input is concatenated into a query so that it changes the query’s structure rather than only its values. In Node the string-building habit is the risk, not the database.
SQL injection: `SELECT * FROM users WHERE email = '${req.body.email}'` lets ' OR 1=1 -- return every user. The defence is parameterised queries, where the driver sends the SQL text and the values separately so the server never parses input as SQL.
// vulnerable
const bad = await pool.query(
  `SELECT id FROM users WHERE email = '${email}'`);
// safe (pg): placeholders, values sent out-of-band
const ok = await pool.query(
  'SELECT id FROM users WHERE email = $1', [email]);
NoSQL injection targets MongoDB-style query objects. If the body is JSON and the code does User.findOne({ email: req.body.email, password: req.body.password }), a client can send {"password": {"$ne": ""}} and bypass the check, because the operator object is accepted as a query. Defences: validate that fields are primitive strings (Zod z.string() rejects objects), use mongo-sanitize or Mongoose’s sanitizeFilter option, and never pass $where or user-controlled JavaScript.
Related rules:
- ORMs and query builders (Prisma, Knex, Drizzle) parameterise by default, but their
raw()escape hatches do not. - Identifiers (table, column names) cannot be parameterised; allowlist them.
LIKEpatterns need escaping of%and_even when parameterised.- Database users should have least privilege so a successful injection cannot
DROP TABLE.
32In a real project using Node.js, how would you apply, test, or troubleshoot SQL injection and NoSQL injection?
Apply. A reporting service with dynamic filters uses Knex: user-selected columns are mapped through an allowlist object ({ created: 'created_at', total: 'total_cents' }) before reaching .orderBy(), values always go through bindings, and the one knex.raw call for a window function takes ?? and ? placeholders. The Mongo-backed profile service enables Mongoose sanitizeFilter: true globally and validates all request bodies with schemas that reject objects where strings are expected. The application’s database role has no DDL rights.
Test. Unit tests send classic payloads (' OR 1=1 --, "; DROP TABLE users; --, {"$gt": ""}) to each endpoint and assert a 400 or an empty result, never a 500 with a database error. sqlmap and OWASP ZAP run against a staging environment in a nightly pipeline. A custom ESLint rule flags template literals passed to query, raw or $where. Query logs in tests are captured and asserted to contain $1 placeholders rather than inlined values.
Troubleshoot. A WAF alert or an unexpected syntax error at or near in Postgres logs with user-looking text is the signature of concatenated input; searching the codebase for `SELECT template strings finds the culprit. Authentication succeeding with a garbage password in the Mongo service points to operator injection; dumping req.body shows $ne. Slow queries with LIKE '%...%' and % in input hint at unescaped wildcards.
The important consideration: ORMs reduce but do not eliminate risk; every raw, $where, sequelize.literal or string-built identifier needs a review.
33Explain rate limiting in the context of Node.js.
Rate limiting caps how many requests a client may make in a window, protecting a Node service from abuse, brute force and accidental overload. The usual algorithms are fixed window (simple counter per minute, bursty at boundaries), sliding window log or sliding window counter (smoother), and token bucket (allows controlled bursts while enforcing an average rate). The client key is typically the API key or user ID, falling back to IP with trust proxy configured so the real address is read from X-Forwarded-For.
import rateLimit from 'express-rate-limit';
import { RedisStore } from 'rate-limit-redis';

app.use('/auth/login', rateLimit({
  windowMs: 15 * 60 * 1000, limit: 10,
  keyGenerator: (req) => req.ip,
  standardHeaders: 'draft-7',           // RateLimit-* headers
  store: new RedisStore({ sendCommand: (...a) => redis.sendCommand(a) }),
}));
Design points:
- An in-memory store only limits per process; with cluster or multiple pods the counter must live in Redis (atomic
INCRwithEXPIRE, or a Lua script for sliding windows). - Respond with 429 and
Retry-After;RateLimit-Limit/RateLimit-Remainingheaders let well-behaved clients adapt. - Different limits per route: strict for login and password reset, generous for reads.
- Edge rate limiting (CDN, API gateway) stops volumetric abuse before it reaches Node; application limits handle per-user business rules.
- The same idea applies outbound:
bottleneckorp-throttlekeep calls to third-party APIs within their quotas.
34In a real project using Node.js, how would you apply, test, or troubleshoot rate limiting?
Apply. A public API running six pods behind an ALB uses a two-tier scheme: the gateway enforces 1,000 requests per minute per IP, and the Node service applies per-API-key plans (free 60/min, pro 600/min) with a sliding-window Lua script in Redis keyed by plan:key:minute. Login endpoints get a separate 10-per-15-minutes limit keyed by IP plus username so a single attacker cannot lock out legitimate users. Limits are configurable per key for enterprise overrides without redeploy.
Test. Unit tests for the Redis script run against a redis-memory-server, issuing N+1 calls and asserting the last returns a rejection and Retry-After is correct. supertest tests assert the 429 body and RateLimit-* headers. A load test with k6 ramps to double the limit and verifies that observed success rate matches the configured ceiling within a few percent, and that the counter is shared across two running instances. Clock-edge tests exercise the window boundary.
Troubleshoot. All users sharing one bucket is the classic missing app.set('trust proxy', ...); every request appears to come from the load balancer IP. Inconsistent limiting across pods reveals the default memory store. Redis latency spikes under heavy traffic show that each request does several round trips; the Lua script collapses them to one. Legitimate mobile clients hitting 429 after retries point to missing exponential backoff honouring Retry-After.
The trade-off to mention: rate limiting by IP penalises users behind corporate NAT, so prefer authenticated keys wherever possible.
35Explain worker threads and child processes in the context of Node.js.
Both move work off the main event loop, but at different granularity. worker_threads runs JavaScript in additional V8 isolates inside the same process; each worker has its own event loop and heap, communicates by message passing (postMessage, structured clone) and can share memory through SharedArrayBuffer. child_process spawns a separate OS process, either another Node program (fork, with an IPC channel) or any executable (spawn, exec, execFile), communicating via stdio pipes or IPC.
| Aspect | worker_threads | child_process |
|---|---|---|
| Isolation | Same process, separate isolate | Separate process, separate memory |
| Startup cost | Low (tens of ms) | Higher (new process) |
| Data sharing | SharedArrayBuffer, transferable buffers | Serialised over pipes/IPC |
| Crash impact | Error event; process survives | Child exits; parent survives |
| Best for | CPU-heavy JS: parsing, hashing, image math | Running CLIs, legacy tools, isolation |
import { Worker } from 'node:worker_threads';

export function hashInWorker(payload) {
  return new Promise((resolve, reject) => {
    const w = new Worker(new URL('./hash-worker.js', import.meta.url),
      { workerData: payload });
    w.once('message', resolve);
    w.once('error', reject);
    w.once('exit', (code) => code !== 0 &&
      reject(new Error(`worker exited ${code}`)));
  });
}
In practice a pool (piscina, or a hand-rolled one) is used rather than spawning per task, and spawn with streams is preferred over exec for large output because exec buffers everything into memory.
36In a real project using Node.js, how would you apply, test, or troubleshoot worker threads and child processes?
Apply. In a document-processing API, PDF text extraction and bcrypt-style hashing run in a piscina pool sized to os.availableParallelism() - 1, with tasks posted as transferable ArrayBuffers to avoid copying 20 MB uploads. Video transcoding shells out to ffmpeg via spawn, streaming stdout into object storage and stderr into logs; a hard timeout kills the child with SIGKILL after SIGTERM fails. Nothing CPU-bound over a few milliseconds runs on the main thread.
Test. Unit tests target the pure function the worker executes, independent of threading. Integration tests run the pool and assert that 50 parallel tasks complete while a concurrent setImmediate probe keeps firing every few ms, proving the main loop stays responsive. For child processes, tests spawn a fake ffmpeg script that exits non-zero or hangs, asserting error mapping and timeout kill. Memory tests ensure the pool is reused rather than creating a worker per request.
Troubleshoot. ERR_WORKER_OUT_OF_MEMORY or workers crashing silently means heavy tasks need resourceLimits.maxOldGenerationSizeMb tuning or chunking. Zombie ffmpeg processes after parent restarts point to missing detached /signal handling; killing the process group fixes it. exec failing with maxBuffer exceeded is the buffering trap; switch to spawn. Message-passing slowdowns on large objects come from structured cloning; transfer buffers or use SharedArrayBuffer.
The important caveat is that workers do not help I/O-bound code at all and add serialisation cost, so profile first to confirm the bottleneck is CPU.
37Explain cluster and horizontal scaling in the context of Node.js.
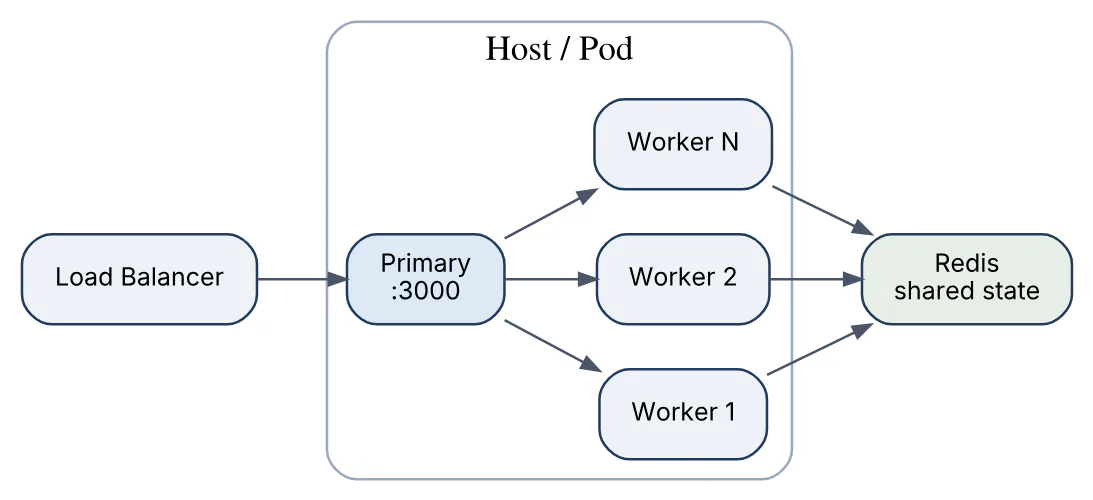
A single Node process uses one CPU core for JavaScript. The node:cluster module forks multiple worker processes from a primary; the primary binds the port and distributes incoming connections to workers (round-robin by default on Linux and macOS, OS-scheduled on Windows). Each worker is a full process with its own memory and event loop, so an 8-core host can run eight copies of the HTTP server behind one port.
import cluster from 'node:cluster';
import { availableParallelism } from 'node:os';

if (cluster.isPrimary) {
  for (let i = 0; i < availableParallelism(); i++) cluster.fork();
  cluster.on('exit', (worker, code) => {
    console.log(`worker ${worker.process.pid} died (${code}), restarting`);
    cluster.fork();
  });
} else {
  await import('./server.js');   // each worker listens on the same port
}
Horizontal scaling extends the same idea across machines: more containers or VMs behind a load balancer. In Kubernetes the usual pattern is one Node process per container with CPU requests of about one core and a Horizontal Pod Autoscaler, letting the orchestrator replace cluster. PM2 in cluster mode is the common choice on plain VMs.
Both forms require the application to be stateless: sessions in Redis, uploads in object storage, in-memory caches treated as per-process optimisations only, and websockets using a Redis adapter for cross-process broadcast. Sticky sessions are a smell that state has leaked into the process.
38In a real project using Node.js, how would you apply, test, or troubleshoot cluster and horizontal scaling?
Apply. On Kubernetes a chat API runs one Node process per pod with requests.cpu: 1, an HPA on CPU and on a custom event_loop_lag metric, and a PodDisruptionBudget so rolling deploys keep capacity. Socket.IO uses the Redis adapter so a message published from pod A reaches clients connected to pod B. On the remaining VM-based legacy service, PM2 cluster mode with instances: max and wait_ready: true provides zero-downtime reloads. Readiness probes gate traffic until the database pool is warm.
Test. Load tests with k6 run against one pod, then three, and the team verifies near-linear throughput and that p99 does not degrade; a sub-linear result points to a shared bottleneck such as the database. A chaos test kills a worker (kill -9) mid-load and asserts no requests fail beyond the in-flight ones and the primary respawns it. Statelessness is tested by disabling sticky sessions and running a logged-in user journey across pods.
Troubleshoot. Users seeing each other’s cart or losing login state reveals process-local caches or MemoryStore sessions. A worker restart loop (exit events every few seconds) usually means an uncaught exception at startup, visible in the worker’s stderr. Uneven load across workers on Linux happens when cluster.schedulingPolicy is set to SCHED_NONE. Memory per worker multiplying the footprint is expected; --max-old-space-size must be set per worker, not per host. Scaling out without raising the database pool ceiling causes too many connections.
The important consideration is that cluster multiplies processes, not database capacity, so connection limits and downstream rate limits must be divided by the number of instances.
39Explain database connection pooling in the context of Node.js.
A connection pool keeps a set of open database connections and lends them to queries, instead of opening a TCP and authentication handshake per request. Opening a Postgres connection costs tens of milliseconds and server-side memory, and databases cap the total (max_connections, often 100), so an unpooled Node service under load exhausts them quickly.
Drivers pool natively: pg.Pool, mysql2.createPool, the MongoDB driver (maxPoolSize, default 100), and ORMs such as Prisma and Sequelize configure the pool in their connection URL or options. A query borrows a connection, runs, and release() returns it; if none are free, the request waits in a queue up to connectionTimeoutMillis.
import pg from 'pg';
export const pool = new pg.Pool({
  connectionString: process.env.DATABASE_URL,
  max: 10,                        // per process
  idleTimeoutMillis: 30_000,
  connectionTimeoutMillis: 5_000,
});
// pool.query() acquires and releases automatically
const { rows } = await pool.query('SELECT 1 AS ok');
Sizing: the total across all Node processes must stay under the database limit with headroom for migrations and admin tools; 10 pods with max: 10 already means 100. A pool of 5–10 per process is usually enough because the database is bound by CPU and disk, not by connection count. In serverless environments where every invocation is a process, an external pooler such as PgBouncer or RDS Proxy sits in front of the database.
Interview takeaway: the pool is per process; multiply by instances before you set max.
40In a real project using Node.js, how would you apply, test, or troubleshoot database connection pooling?
Apply. An order service running eight pods against Postgres (max_connections = 200) sets pg.Pool({ max: 12 }), leaving headroom for migrations, analytics and failover. The pool is created once at module scope and exported, never per request. Transactions use pool.connect() and release in a finally block. Read-heavy reports use a second pool pointed at a read replica. In the Lambda-based webhook handler, connections go through RDS Proxy because each cold start would otherwise open its own connection.
Test. Integration tests spin Postgres in Testcontainers and assert that 100 parallel queries complete with the pool capped at 10, measuring that pool.waitingCount rises and falls back to zero. A leak test runs a transaction path that throws midway and asserts pool.idleCount + pool.waitingCount matches pool.totalCount afterwards. Load tests compare p99 latency with max of 5, 10 and 20 to pick the knee of the curve rather than guessing.
Troubleshoot. Error: timeout exceeded when trying to connect under load means every connection is checked out, almost always a leaked client from a code path that forgot client.release(); pool.on('acquire') / 'release' counters per route locate it. FATAL: too many connections after scaling out means the per-process max was never multiplied by pod count. Slow queries holding connections show up in pg_stat_activity with state = 'idle in transaction', pointing at a transaction that awaits an external HTTP call while holding a client.
The key consideration: a larger pool rarely helps once the database CPU is saturated; it only lengthens queues inside the database instead of inside Node.
41Explain transaction management in the context of Node.js.
A transaction groups several statements so they commit or roll back together, preserving atomicity and isolation. Because a Node pool hands out connections per query, a transaction must pin one connection for its whole duration; pool.query() across statements would run BEGIN and COMMIT on different sockets. The pattern is: acquire a client, BEGIN, run statements, COMMIT on success, ROLLBACK on any error, release in finally.
export async function withTransaction(pool, work) {
  const client = await pool.connect();
  try {
    await client.query('BEGIN');
    const result = await work(client);
    await client.query('COMMIT');
    return result;
  } catch (err) {
    await client.query('ROLLBACK');
    throw err;
  } finally {
    client.release();
  }
}

await withTransaction(pool, async (tx) => {
  await tx.query('UPDATE accounts SET balance = balance - $1 WHERE id = $2',
    [amount, from]);
  await tx.query('UPDATE accounts SET balance = balance + $1 WHERE id = $2',
    [amount, to]);
});
ORMs wrap this: Prisma prisma.$transaction(async (tx) => ...), Knex knex.transaction(), TypeORM dataSource.transaction(), Mongoose sessions with withTransaction() on replica sets. Isolation level is set with BEGIN ISOLATION LEVEL SERIALIZABLE when needed, and serialization failures (40001) should be retried.
Keep transactions short and free of network calls to other services; a transaction awaiting an HTTP request holds a lock and a pooled connection for the duration. For operations spanning services, use outbox tables or sagas rather than distributed transactions.
42In a real project using Node.js, how would you apply, test, or troubleshoot transaction management?
Apply. In a wallet service, a transfer runs inside withTransaction: lock both account rows with SELECT ... FOR UPDATE ordered by ID to avoid deadlocks, check funds, insert ledger entries, and write an outbox row in the same transaction so the “transfer completed” event is published atomically with the state change. The transaction context is propagated with AsyncLocalStorage so repository functions pick up the active client without threading tx through every signature. Serialization failures are retried up to three times with jitter.
Test. Integration tests against Testcontainers Postgres assert that a failure after the debit leaves both balances unchanged and no outbox row. A concurrency test launches two transfers between the same accounts in parallel and asserts totals are conserved and no deadlock error escapes. Tests for the retry wrapper inject a 40001 error once and assert a second attempt succeeds. Each test runs inside a transaction that is rolled back at the end, giving isolation without truncation.
Troubleshoot. deadlock detected in logs points to inconsistent lock ordering; the fix is sorting IDs before locking. Pool exhaustion with many idle in transaction sessions in pg_stat_activity reveals a transaction awaiting a payment gateway call; move the call outside and use the outbox. Partial writes with no error indicate a repository using pool.query inside a transaction, silently bypassing the client. Mongo “Transaction numbers are only allowed on a replica set member” means the local dev database is standalone.
The important consideration: long-running transactions block vacuum and other writers in Postgres, so measure transaction duration as a first-class metric.
43Explain queues and background jobs in the context of Node.js.
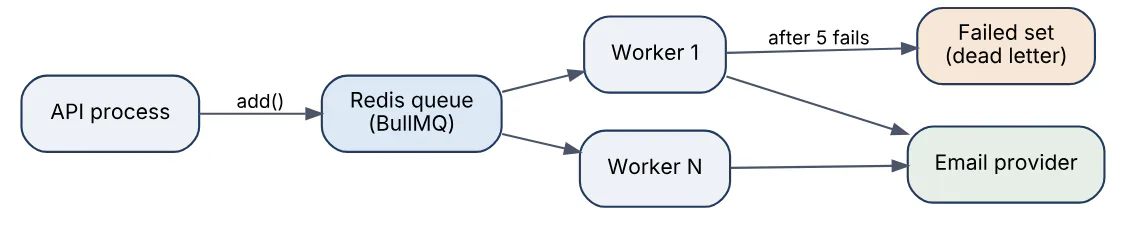
A queue decouples accepting work from doing it. The web process enqueues a job (send email, generate invoice, resize image) and returns immediately; worker processes consume jobs at their own pace, retry failures and spread load. In Node the Redis-backed BullMQ is the most common choice, with alternatives in RabbitMQ (amqplib), AWS SQS, Kafka (kafkajs) for high-throughput streams, and Postgres-based queues such as pg-boss or Graphile Worker when avoiding another datastore.
import { Queue, Worker } from 'bullmq';
const connection = { host: 'redis', port: 6379 };

export const invoices = new Queue('invoices', { connection,
  defaultJobOptions: { attempts: 5,
    backoff: { type: 'exponential', delay: 2000 },
    removeOnComplete: 1000 } });

// separate worker process
new Worker('invoices', async (job) => {
  await renderAndEmail(job.data.orderId);   // must be idempotent
}, { connection, concurrency: 10 });
Concepts that matter:
- At-least-once delivery: a job may run twice after a crash, so handlers must be idempotent (check a
processed_jobstable or use a uniquejobId). - Retries with backoff and a dead-letter queue for jobs that exhaust attempts.
- Concurrency is per worker; scale by adding worker processes, not by raising concurrency on CPU-bound jobs.
- Delayed and repeatable jobs replace cron for scheduled work.
- Transactional enqueue: writing the job in the same database transaction as the state change (outbox pattern) avoids “order saved but email job lost”.
This diagram shows the separation between the API process and the worker fleet.
44In a real project using Node.js, how would you apply, test, or troubleshoot queues and background jobs?
Apply. An e-commerce checkout writes the order and an outbox row in one transaction; a relay process polls the outbox and enqueues BullMQ jobs with jobId = order:${id}:invoice so duplicates are deduplicated by Redis. Workers run as a separate Kubernetes Deployment scaled on queue depth via KEDA. Jobs are kept small (an ID, not the payload), handlers reload state from the database, and anything calling third parties sets its own timeout. Bull Board gives operators visibility and manual retry.
Test. Handlers are unit-tested as plain functions with the job.data shape. Integration tests use a real Redis container, add a job, run a Worker with concurrency 1, and await job.waitUntilFinished(events). Idempotency is proven by processing the same job twice and asserting one email call. A failure-path test makes the handler throw and asserts the job lands in failed after the configured attempts with the backoff delays recorded. Contract tests validate payload schemas between producer and consumer versions.
Troubleshoot. Queue depth climbing while workers are idle usually means a Worker connected to a different Redis prefix or queue name after a config change. Jobs stuck in active after a worker crash are recovered by BullMQ’s stalled-job check, but a lockDuration shorter than the job’s real duration causes the same job to run twice; raise it or report progress. Memory growth in Redis comes from removeOnComplete: false. Repeated failures with the same error are inspected in the failed set and replayed after a fix.
The important consideration: retries amplify load on a struggling downstream, so combine backoff with a circuit breaker for external calls.
45Explain caching with Redis in the context of Node.js.
Redis is an in-memory key-value store that Node services use to avoid repeating expensive work: database queries, rendered fragments, third-party API responses, computed permissions. Clients are ioredis (feature-rich, cluster support) and the official redis package (node-redis v4+). Values are strings, so objects are JSON.stringifyed; hashes, sets, sorted sets and streams cover more structured needs.
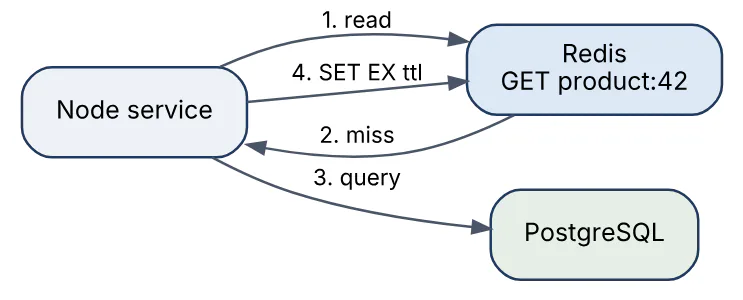
The dominant pattern is cache-aside: read from Redis; on a miss, load from the source, write back with a TTL, return.
export async function getProduct(id) {
  const key = `product:${id}`;
  const hit = await redis.get(key);
  if (hit) return JSON.parse(hit);
  const product = await db.products.findById(id);
  if (product) {
    const ttl = 300 + Math.floor(Math.random() * 60);  // jitter
    await redis.set(key, JSON.stringify(product), 'EX', ttl);
  }
  return product;
}
The read path on a miss is shown below.
Design decisions:
- TTL on everything; add jitter so many keys do not expire at once.
- Invalidation on write (
DEL product:42) for data that must be fresh; TTL-only for data that tolerates staleness. - Stampede protection: on a miss under load, use a short lock key (
SET lock:x 1 NX PX 2000) or in-process request coalescing so one caller rebuilds and others wait. - Negative caching of “not found” with a short TTL blocks repeated misses.
- Key naming with a version prefix (
v2:product:42) allows schema changes without a flush.
Besides caching, the same Redis often backs sessions, rate limits, pub/sub and queues, which argues for separate logical databases or instances so a cache flush does not drop sessions.
46In a real project using Node.js, how would you apply, test, or troubleshoot caching with Redis?
Apply. A product catalogue API caches product detail (ttl 5 minutes with jitter), category listings (60 seconds) and the permission set per user (10 minutes, invalidated on role change by the auth service publishing a Redis pub/sub message). Writes go through a repository that deletes the affected keys after the database commit, never before. Hot-key reads for the homepage additionally use a 2-second in-process LRU so a Redis blip does not take down the front page. ioredis is configured with enableOfflineQueue: false and a 100 ms command timeout so the service degrades to the database rather than hanging.
Test. Unit tests use ioredis-mock to assert hit, miss, write-back and invalidation ordering. Integration tests against a Redis container verify TTLs with PTTL and that the stampede lock allows exactly one database call when 50 concurrent requests miss. A chaos test stops Redis and asserts requests still succeed, slower, with the cache_errors_total metric incrementing. Hit ratio is asserted in a load test to exceed a target.
Troubleshoot. Stale prices after an edit mean invalidation ran before the commit or a key pattern mismatch; logging the deleted key alongside the write finds it. MaxRetriesPerRequestError floods on a Redis failover reveal missing timeouts and the offline queue. redis-cli --bigkeys and MEMORY USAGE locate an oversized key such as a whole category tree. A sudden database load spike at a round hour is synchronised expiry without jitter. used_memory near maxmemory with allkeys-lru evicting sessions is the shared-instance problem.
The important consideration: caching hides latency problems in the source; track hit ratio and source p99 separately so a regression is not masked until Redis restarts.
47Explain observability and tracing in the context of Node.js.
Observability is the ability to explain a production problem from the telemetry a service emits: structured logs, metrics and distributed traces, correlated by IDs. In Node the standard stack is OpenTelemetry for traces and metrics, pino for structured JSON logs, and a backend such as Grafana Tempo, Jaeger, Honeycomb or Datadog.
Distributed tracing follows one request across services: the first hop creates a trace ID, each unit of work is a span with timing and attributes, and the traceparent header (W3C Trace Context) propagates the context over HTTP and message queues. OpenTelemetry’s Node SDK auto-instruments http, express, fastify, pg, ioredis and others by patching modules at load time, so a database span appears under the request span without code changes.
// instrumentation.mjs, loaded with: node --import ./instrumentation.mjs app.mjs
import { NodeSDK } from '@opentelemetry/sdk-node';
import { getNodeAutoInstrumentations }
  from '@opentelemetry/auto-instrumentations-node';
import { OTLPTraceExporter }
  from '@opentelemetry/exporter-trace-otlp-http';

const sdk = new NodeSDK({
  serviceName: 'orders-api',
  traceExporter: new OTLPTraceExporter(),      // OTLP to a collector
  instrumentations: [getNodeAutoInstrumentations()],
});
sdk.start();
One trace spanning three hops looks like this; every hop forwards traceparent.

Node-specific signals worth collecting:
- Event loop lag (
perf_hooks.monitorEventLoopDelay) and active handles, the earliest indicators of saturation. - Heap used, RSS and GC pause time via
perf_hooksorprom-clientdefault metrics. - Pool wait counts and queue depths.
- Logs carrying
trace_idandspan_id, whichpinocan inject from the active OpenTelemetry context, so a log line links to its trace.
Context propagation across await relies on AsyncLocalStorage, which is also how request IDs reach deep code without parameter threading.
48In a real project using Node.js, how would you apply, test, or troubleshoot observability and tracing?
Apply. A microservice platform standardises a shared telemetry package: OpenTelemetry SDK with auto-instrumentation plus manual spans around business steps (span.setAttribute('order.id', id)), pino logs with trace_id injected, and Prometheus metrics for request duration histograms, event loop lag and pool wait time. Sampling is head-based at 10% in production with tail-based retention of all error traces in the collector. BullMQ jobs carry the traceparent in job data so a trace spans API, queue and worker. Dashboards alert on p99 latency and loop lag per service, and every alert links to an exemplar trace.
Test. Integration tests use the OpenTelemetry in-memory span exporter and assert a request produces the expected spans with the right parent-child relations and attributes, catching broken propagation when a library is upgraded. A test asserts the traceparent header is forwarded to an outbound fetch. Log tests parse JSON output and assert required fields. A /metrics endpoint test checks the histogram exists and is labelled correctly.
Troubleshoot. Traces breaking into fragments after an upgrade usually mean the instrumentation loaded after the instrumented module; it must be registered via --import or --require before application code. Missing database spans in ESM apps are the known need for the ESM loader hook (@opentelemetry/instrumentation with --experimental-loader, or the --import register in recent versions). A 500 with no trace is sampling dropping errors; move error retention to the collector. High CPU after enabling telemetry points to synchronous exporters or verbose debug-level logging.
The important consideration: telemetry has a cost in CPU and egress, so sample traces, keep cardinality of metric labels bounded (never a user ID label) and measure the overhead.
49Explain graceful shutdown in the context of Node.js.
Graceful shutdown means that when a Node process is told to stop, it finishes in-flight work, refuses new work, releases resources and exits cleanly instead of dropping connections. Orchestrators send SIGTERM (Kubernetes gives 30 seconds by default via terminationGracePeriodSeconds, then SIGKILL), and process managers like PM2 do the same. Without a handler, Node’s default on SIGTERM is to exit immediately, cutting active HTTP responses and leaving transactions open.
const server = app.listen(3000);
let shuttingDown = false;

async function shutdown(signal) {
  if (shuttingDown) return; shuttingDown = true;
  log.info({ signal }, 'shutdown started');
  healthy = false;                                 // readiness -> 503
  server.close();                                  // stop accepting
  server.closeIdleConnections();                   // Node 18.2+
  const timer = setTimeout(() => process.exit(1), 25_000).unref();
  await Promise.allSettled([queueWorker.close(), pool.end(), redis.quit()]);
  clearTimeout(timer);
  process.exit(0);
}
process.on('SIGTERM', shutdown);
process.on('SIGINT', shutdown);
The sequence matters:
- Flip the readiness probe to failing so the load balancer stops routing new requests; wait a few seconds for propagation.
server.close()stops accepting; existing keep-alive sockets stay until idle, socloseIdleConnections()and, as a last resort,closeAllConnections()finish them.- Stop consuming queue jobs and let running ones complete.
- Close database pools and Redis clients so the OS does not see abrupt resets.
- Exit with a hard deadline shorter than the orchestrator’s grace period.
In containers, the process must receive the signal: run node server.js directly or use tini as PID 1, because a shell wrapper swallows SIGTERM.
50In a real project using Node.js, how would you apply, test, or troubleshoot graceful shutdown?
Apply. A payments API on Kubernetes implements a shutdown module shared across services: on SIGTERM it sets readiness to 503, sleeps 5 seconds to let endpoints update, calls server.close() and closeIdleConnections(), waits for in-flight requests tracked by a counter, drains the BullMQ worker so a half-processed payment job is finished rather than retried, then ends the Postgres pool and Redis clients. terminationGracePeriodSeconds is 40 and the internal deadline 30. The Dockerfile uses CMD ["node", "server.js"] with no shell and a preStop hook that sleeps 5 seconds.
Test. An integration test starts the server, opens a slow request (handler waits 2 seconds), sends process.kill(pid, 'SIGTERM') after 500 ms, and asserts the slow request completes with 200, a new request is refused, and the exit code is 0 within the deadline. A second test blocks pool.end() and asserts the fallback timer exits with code 1. Rolling-deploy tests run k6 during kubectl rollout restart and assert zero non-2xx responses.
Troubleshoot. 502s during deploys despite a handler usually mean the readiness flip and the drain race: traffic still arrived after server.close(); the fix is the delay before closing. Pods taking the full grace period and then being killed indicate keep-alive sockets held open by the load balancer; closeIdleConnections() resolves it. Shutdown never triggering in Docker is the shell-wrapper PID 1 problem, confirmed by docker exec ... ps showing sh as PID 1. Duplicate job processing after deploys means the worker was not closed before the process exited.
The important consideration: process.exit() inside the handler must be the last step, because it does not wait for pending asynchronous closes, and beforeExit never fires when it is called.
Answers tailored to your resume and job description
Add your resume and the job description in CrackItX's Settings. When the interviewer asks a Node.js question, Claude suggests an answer using your real projects and the role's requirements, in real time.
See pricing →