Top 50 Azure Synapse Analytics
interview questions
Dedicated and serverless SQL pools, Spark pools and pipelines. Open a question to read the answer.
01Explain Azure Synapse architecture in the context of Azure Synapse / Synopsys (confirm).
Azure Synapse Analytics is a unified analytics platform that combines a massively parallel processing (MPP) data warehouse, serverless SQL over the data lake, Apache Spark, and data-integration pipelines under one workspace. (The worksheet title mentions “Synopsys”; that is an unrelated electronic-design company, so every question here is answered for Azure Synapse Analytics.)
The workspace is a control plane. It owns identity (a managed identity), networking, Git integration and Synapse Studio, and it attaches compute engines on demand:
- Dedicated SQL pool – provisioned MPP warehouse (formerly SQL Data Warehouse), measured in DWUs.
- Serverless SQL pool – always-available, pay-per-TB-scanned T-SQL endpoint over files in ADLS Gen2.
- Apache Spark pools – autoscaling clusters running a Microsoft-maintained Spark runtime.
- Pipelines – the Azure Data Factory engine embedded in the workspace for orchestration and data movement.
All engines share a primary ADLS Gen2 account, so data lands once and is read by whichever engine fits the job. The diagram shows the main components and how they relate.
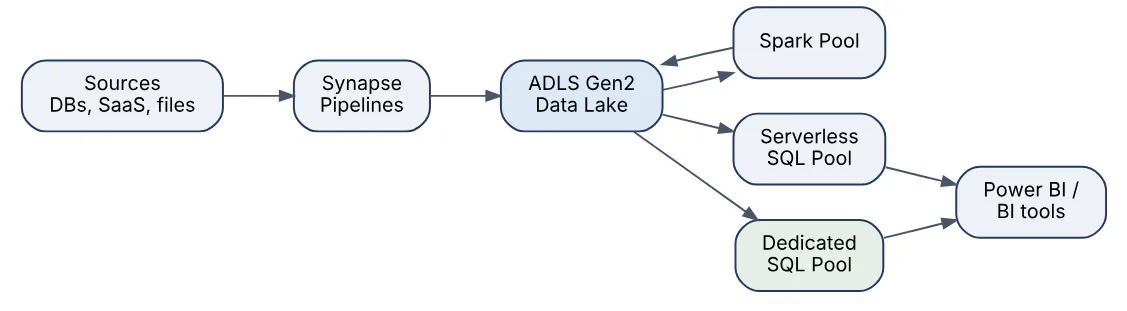
Microsoft now positions Microsoft Fabric as the strategic successor and publishes migration guidance, but Synapse remains a fully supported Azure service with no announced retirement date.
02In a real project using Azure Synapse / Synopsys (confirm), how would you apply, test, or troubleshoot Azure Synapse architecture?
Apply. For a retail reporting warehouse I would land raw files from the ERP and web clickstream into ADLS Gen2 via pipelines, curate them to Delta/Parquet with Spark, and serve the gold layer two ways: ad-hoc analysts and data scientists query it with the serverless pool, while the finance dashboards hit a dedicated pool loaded nightly with COPY INTO. One workspace per environment (dev, test, prod), each with its own storage account and managed identity.
Test. Architecture is validated with an end-to-end smoke pipeline that runs in every environment after deployment: ingest a known sample, transform it, and assert row counts and checksums in both SQL endpoints. Network and identity are tested explicitly, for example confirming that the workspace managed identity can read the lake and that public access to storage is denied.
Troubleshoot. The most common failure is an engine that cannot reach storage: Spark jobs fail with 403 or serverless returns “cannot bulk load”. I check the storage firewall, the Storage Blob Data Contributor role on the managed identity, and whether the request goes through a managed private endpoint. For cost or latency complaints I compare the engine choice to the workload: a dedicated pool left running for a handful of queries, or serverless scanning uncompressed CSV, usually explains it.
The main consideration is that each engine has a separate security and metadata model; a table created in Spark is visible to serverless but not to the dedicated pool, which surprises teams who expect one catalogue.
03Explain dedicated versus serverless SQL pools in the context of Azure Synapse / Synopsys (confirm).
Both expose a T-SQL endpoint, but they are different engines with different storage and billing models.
| Aspect | Dedicated SQL pool | Serverless SQL pool |
|---|---|---|
| Compute | Provisioned MPP cluster sized in DWUs | Auto-provisioned, scales per query |
| Storage | Data loaded into managed columnstore tables | Reads files in place (Parquet, Delta, CSV) |
| Billing | Per hour while running; can pause | Per TB of data processed |
| Latency | Consistent, tuned for heavy joins and aggregates | Depends on file layout; cold-start overhead |
| Typical use | Curated warehouse with SLAs | Lake exploration, logical warehouse, ad-hoc |
A dedicated pool is the right choice when the same large fact tables are queried repeatedly and predictable performance justifies a continuously running cluster. Serverless suits exploration, lightweight views over the lake, and low-frequency workloads where paying per scan is cheaper than paying for idle compute. Many designs use both: Spark writes Delta to the lake, serverless exposes it immediately, and the dedicated pool holds only the aggregates that need sub-second dashboards.
Serverless cannot store data; it supports external tables, views and CREATE EXTERNAL TABLE AS SELECT, but not ordinary INSERT into managed tables.
04In a real project using Azure Synapse / Synopsys (confirm), how would you apply, test, or troubleshoot dedicated versus serverless SQL pools?
Apply. In a logistics analytics project I put shipment facts and dimension tables that back the executive dashboards into a dedicated pool at DW500c, scheduled to pause outside business hours. Everything else, including raw telemetry and one-off investigations, stays in Parquet and is queried through serverless views in a lake database, so analysts never wait for a load job to make new data visible.
Test. Before committing to an engine I benchmark the top twenty dashboard queries on both: wall-clock time, concurrency at ten simultaneous users, and cost from the sys.dm_pdw_exec_requests DMV versus the serverless data_processed figures in the monitoring hub. For serverless I also test file layout changes, because converting CSV to partitioned Parquet typically cuts scanned bytes by an order of magnitude.
Troubleshoot. A serverless query that is suddenly slow or expensive usually means a schema change produced many small files or a filter is not pushed down to partition folders; I check filepath() predicates and compact the files with Spark. A dedicated pool showing queued requests means the concurrency slots of the chosen DWU level are exhausted, visible in sys.dm_pdw_exec_requests with status Suspended; the fix is scaling up or a workload group.
One mistake to avoid is treating serverless as a free tier: a SELECT * over a multi-terabyte folder is billed in full even if the query is cancelled.
05Explain Synapse Spark pools in the context of Azure Synapse / Synopsys (confirm).
A Synapse Spark pool is a definition of an Apache Spark cluster: node size, minimum and maximum node count, autoscale and auto-pause settings, and a runtime version. No compute runs until a notebook, Spark job definition or pipeline activity requests a session; the pool then provisions nodes, runs the workload and shuts down after the idle timeout.
Key characteristics:
- Runs the Azure Synapse Runtime for Apache Spark, a Microsoft-maintained bundle of Spark, Delta Lake, Python and .NET libraries. Runtime 3.5 is the current supported version; 3.3 and 3.4 have reached end of support.
- Authenticates to ADLS Gen2 with the user’s Microsoft Entra identity in notebooks and with the workspace managed identity in pipelines.
- Shares a lake database metastore with the serverless SQL pool, so a table saved with
saveAsTableis queryable from T-SQL. - Supports PySpark, Scala, Spark SQL, and SparkR, plus library management through requirements files or wheel uploads.
- Dynamic executor allocation lets one session scale within the pool’s bounds.
Spark pools are the choice for heavy transformations, semi-structured data, Delta Lake maintenance and machine learning, while SQL pools remain better for serving relational queries to BI tools.
06In a real project using Azure Synapse / Synopsys (confirm), how would you apply, test, or troubleshoot Synapse Spark pools?
Apply. For a clickstream project ingesting several hundred GB of JSON a day, I define two pools: a small autoscaling pool (3–10 medium nodes, 15-minute auto-pause) for notebook development, and a larger job pool used only by pipelines. The transformation code lives in a Spark job definition packaged as a wheel, writes partitioned Delta tables to the curated zone, and runs OPTIMIZE and VACUUM weekly.
Test. Transformation logic is unit-tested locally with pyspark and pytest against small fixture files; the same functions run unchanged in Synapse. An integration notebook executed by the CI pipeline loads a known sample and asserts schema, row counts and null ratios. I also run a load test at production volume once, watching executor memory and shuffle spill in the Spark UI to pick the node size.
Troubleshoot. A job that fails with Container killed ... exceeding memory limits points to skewed partitions or an oversized collect(); the Spark history server shows the straggling task, and salting the join key or repartitioning fixes it. Long queue times before a session starts usually mean the pool’s maximum nodes are held by another session, so I separate dev and job pools. Library conflicts show up as import errors at session start and are diagnosed from the driver log in the monitoring hub.
Spark pool minutes are billed from node start, so an interactive pool left without auto-pause is the most common unexpected cost.
07Explain Synapse pipelines in the context of Azure Synapse / Synopsys (confirm).
Synapse pipelines are the orchestration and data-movement service built into the workspace. They are the Azure Data Factory engine with the same activity model, so skills transfer directly; the difference is that pipelines can call Synapse notebooks, Spark job definitions and SQL pool stored procedures as first-class activities.
A pipeline is a JSON definition made of:
- Activities – Copy, Data Flow (visual Spark transformations), Notebook, Script, Stored Procedure, Lookup, ForEach, If, Until, Web, Execute Pipeline.
- Linked services and datasets – connection and shape definitions used by Copy and Lookup.
- Integration runtimes – the compute that executes activities: the Azure IR for cloud sources, a self-hosted IR for on-premises or private networks.
- Triggers – schedule, tumbling window, storage event or custom event.
A typical nightly load, shown below, is a Copy activity from an operational database into the raw zone, a Notebook activity that builds Delta tables, and a Stored Procedure activity that merges into the dedicated pool, with dependencies expressed as success/failure arrows between activities.
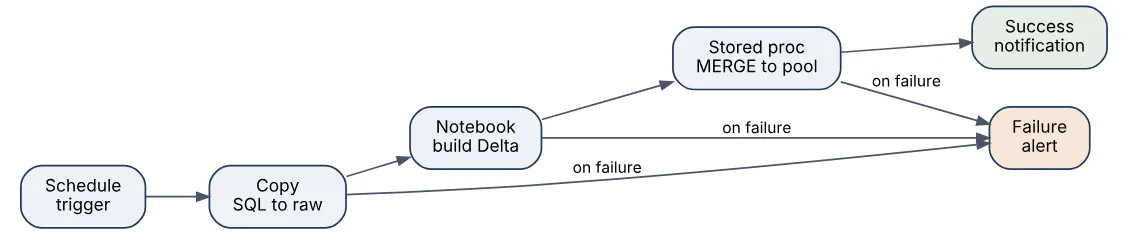
Pipelines are stored as artifacts in the workspace and can be source-controlled through Git integration.
08In a real project using Azure Synapse / Synopsys (confirm), how would you apply, test, or troubleshoot Synapse pipelines?
Apply. In an insurance claims warehouse I build one parameterised “ingest table” pipeline driven by a control table: a Lookup reads the list of source tables and watermarks, a ForEach runs a Copy activity per table into raw/<system>/<table>/<date>/, and a final Notebook activity merges Delta tables. A parent pipeline chains ingestion, transformation and the dedicated pool load so dependencies are explicit and a failure stops downstream steps.
Test. Every pipeline runs in the dev workspace against a sample database with Debug, then the deployment pipeline executes it in the test workspace and a validation Script activity compares source and target counts, failing the run on mismatch. I keep activities idempotent (overwrite the date folder, MERGE rather than INSERT) so a rerun after a partial failure is safe to test.
Troubleshoot. The monitoring hub shows the failed activity with its error payload; the usual causes are a source timeout, a schema drift that breaks the Copy mapping, or an expired credential. For throughput problems I inspect the Copy activity details for parallel copies and data integration units and adjust the parallelCopies setting or partition the source read. Hung ForEach loops are usually caused by isSequential combined with a slow activity, so I switch to batched parallel execution.
The most important consideration is retry design: set retry counts on transient activities but never on non-idempotent ones, or a retried INSERT double-loads data.
09Explain linked services and datasets in the context of Azure Synapse / Synopsys (confirm).
A linked service is a connection definition: the type of store or compute, its endpoint, and how to authenticate (managed identity, service principal, Key Vault-backed secret, or connection string). A dataset is a named reference to data inside a linked service: a folder and file format in ADLS Gen2, a table in Azure SQL Database, a container in Cosmos DB. Copy, Lookup and Data Flow activities consume datasets; the dataset points at the linked service for connectivity.
Separating the two gives reuse and clean promotion between environments. One ls_adls_lake linked service can back dozens of datasets, and swapping the storage account URL during deployment changes every dataset at once. Datasets are usually parameterised, so a single ds_raw_parquet with folderPath and fileName parameters replaces hundreds of hard-coded definitions.
{
  "name": "ls_adls_lake",
  "properties": {
    "type": "AzureBlobFS",
    "typeProperties": {
      "url": "https://stlakeprod.dfs.core.windows.net"
    }
  }
}
With no credential block the linked service uses the workspace managed identity, which is the recommended pattern because nothing secret is stored in the artifact.
10In a real project using Azure Synapse / Synopsys (confirm), how would you apply, test, or troubleshoot linked services and datasets?
Apply. I keep the number of linked services small and generic: one per source system and environment-specific values supplied through workspace parameters, with secrets referenced from Azure Key Vault via its own linked service. Datasets are generic by format (ds_parquet_lake, ds_sql_table) with path or table name passed from the pipeline, so adding a new source table changes a row in the control table rather than creating artifacts.
Test. Each linked service has the “Test connection” check run from the integration runtime that will execute it, which matters because a connection that works from the Azure IR can fail from a self-hosted IR behind a firewall. In CI I deploy to the test workspace with that environment’s parameter file and run a tiny Copy activity per linked service as a connectivity probe before the real pipelines are allowed to run.
Troubleshoot. Authentication errors after deployment nearly always mean the target workspace’s managed identity lacks Storage Blob Data Contributor or the SQL user for the identity was never created with CREATE USER [ws-prod] FROM EXTERNAL PROVIDER. Key Vault errors show as 403 Forbidden and need an access policy or RBAC role for the workspace identity. A Copy activity that reads zero rows is often a dataset parameter resolving to the wrong folder, visible in the activity’s input JSON in the monitoring hub.
One trap is that a linked service edited directly in the live workspace rather than the Git branch is silently overwritten by the next publish.
11Explain dedicated SQL distributions in the context of Azure Synapse / Synopsys (confirm).
A dedicated SQL pool stores every table across 60 distributions, which are the fixed unit of parallelism in the MPP architecture. The control node accepts a query, the distributed query engine turns it into a plan, and compute nodes each own a subset of the 60 distributions and execute their share in parallel. At DW100c one compute node owns all 60; at DW6000c there are 60 compute nodes with one distribution each, so scaling the pool simply redistributes ownership. The diagram shows the MPP layout at a small scale.
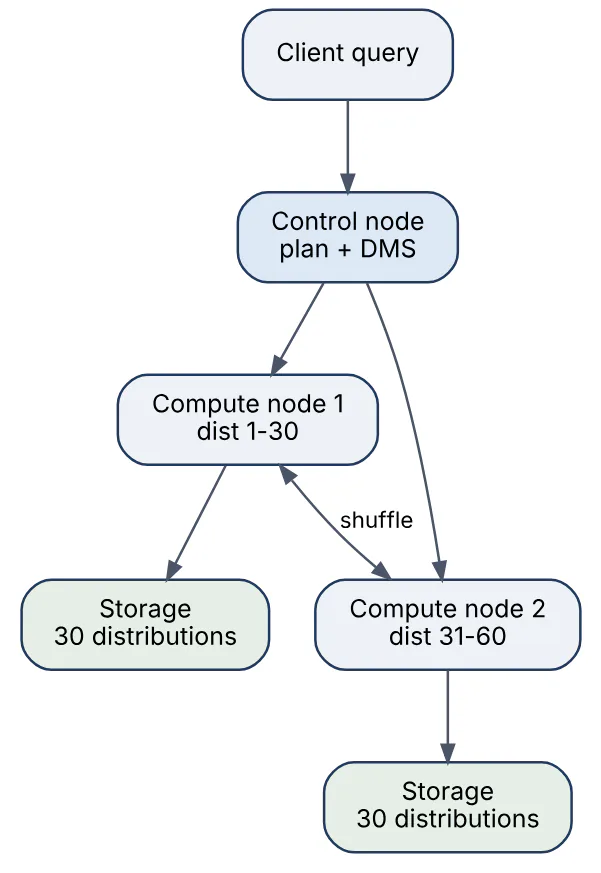
How a table’s rows are assigned to distributions is the distribution strategy chosen in CREATE TABLE: hash on a column, round-robin, or replicated to every compute node. When two tables are joined on columns that are both hash-distributed on the join key, each distribution can join locally. Otherwise the engine must move data between distributions through the Data Movement Service (DMS), shown in query plans as ShuffleMoveOperation or BroadcastMoveOperation, and that movement is usually the dominant cost of a slow warehouse query.
The practical rules that follow are that large fact tables should be hash-distributed on a frequently joined, high-cardinality column, each distribution should ideally hold at least one million rows per partition for good columnstore compression, and data skew across distributions should be kept under roughly ten percent.
12In a real project using Azure Synapse / Synopsys (confirm), how would you apply, test, or troubleshoot dedicated SQL distributions?
Apply. In a telecom billing warehouse the fact_call_detail and fact_invoice_line tables are both hash-distributed on customer_key because most reports join them to each other and to the customer dimension by that key. Columns with many nulls or a handful of values (status, country) are never chosen because they produce skew. Staging tables loaded by COPY INTO are round-robin and then converted with CREATE TABLE AS SELECT into the final distribution.
Test. After each load I run DBCC PDW_SHOWSPACEUSED('dbo.fact_call_detail') and compute the ratio between the largest and smallest distribution; anything above ten percent skew fails the data-quality step. For query design I use EXPLAIN on the top reports and check that the plan contains no ShuffleMoveOperation on the large fact joins.
EXPLAIN
SELECT c.region, SUM(f.amount)
FROM dbo.fact_invoice_line AS f
JOIN dbo.dim_customer AS c ON c.customer_key = f.customer_key
GROUP BY c.region;
Troubleshoot. A report that used to take seconds and now takes minutes is diagnosed from sys.dm_pdw_request_steps, which lists each step with its operation type and row count; a large shuffle step on a join identifies the mismatched key. The fix is a CTAS to re-distribute one table, or making a small dimension replicated. Severe skew appears as one distribution doing most of the work in sys.dm_pdw_sql_requests.
Changing a distribution means rebuilding the table, so the decision should be made from workload analysis before the first production load.
13Explain hash round-robin replicated tables in the context of Azure Synapse / Synopsys (confirm).
These are the three distribution strategies available for a dedicated SQL pool table, each trading data movement against storage and load cost.
| Strategy | How rows are placed | Best for | Watch out for |
|---|---|---|---|
| Hash | Deterministic hash of one column picks the distribution | Large fact tables joined or aggregated on that column | Skew from low-cardinality or null-heavy keys |
| Round-robin | Rows spread evenly in arrival order | Staging tables, tables with no obvious join key | Every join requires a shuffle |
| Replicated | Full copy cached on every compute node | Dimensions under about 2 GB | Rebuild cost after each update |
Round-robin is the default and loads fastest, which is why staging tables use it. Hash distribution is what makes joins and GROUP BY on the key local to each distribution. Replicated tables remove movement entirely for small dimensions, but the first query after a data change triggers a rebuild of the copies, so frequently updated dimensions are better hash-distributed.
CREATE TABLE dbo.fact_sales
WITH (DISTRIBUTION = HASH(customer_key), CLUSTERED COLUMNSTORE INDEX)
AS SELECT * FROM stg.sales;

CREATE TABLE dbo.dim_product
WITH (DISTRIBUTION = REPLICATE, CLUSTERED INDEX (product_key))
AS SELECT * FROM stg.product;
Newer pools also support multi-column hash distribution (up to eight columns), which helps when no single column is selective enough.
14In a real project using Azure Synapse / Synopsys (confirm), how would you apply, test, or troubleshoot hash round-robin replicated tables?
Apply. In a retail warehouse the daily stg_sales landing table is round-robin because COPY INTO is fastest with no hashing. The fact_sales table is hash-distributed on customer_key, the same key used by fact_returns so the two facts join locally. dim_date, dim_store and dim_product (all well under 2 GB) are replicated. dim_customer at 40 million rows is too large to replicate, so it is hash-distributed on customer_key too, giving a fully co-located star for the main reports.
Test. Skew is measured after every load with DBCC PDW_SHOWSPACEUSED and recorded in a monitoring table; a trend upward signals that the key’s cardinality is drifting. For replicated tables I run the top queries twice after a load and compare the first and second run in sys.dm_pdw_exec_requests; a big gap confirms the replication rebuild cost. Query plans for the ten most expensive reports are reviewed for BroadcastMoveOperation, which indicates a dimension the optimizer decided to broadcast and that could be replicated.
Troubleshoot. A nightly load that slowed down after a dimension was changed to replicated usually means the dimension is updated during the load, forcing repeated rebuilds; moving the update to the end or triggering a SELECT TOP 1 after the load warms the copies. Unexpected shuffles appear when a join compares columns of different data types, which defeats co-location even with matching distribution keys.
The choice is not permanent, but every change is a full table rebuild through CTAS, so I keep the DDL in source control with a comment explaining each decision.
15Explain PolyBase and COPY command in the context of Azure Synapse / Synopsys (confirm).
Both load files from Azure Storage into a dedicated SQL pool in parallel across all distributions, bypassing the control node bottleneck of ordinary INSERT.
PolyBase is the older mechanism. It requires an external data source, an external file format and an external table over the files, and then a CREATE TABLE AS SELECT or INSERT ... SELECT from that external table. It is flexible but verbose, demands extra objects, and historically had limits such as no support for row delimiters inside quoted fields.
COPY INTO is the recommended load statement since 2020. It takes the file location, format and credential inline, needs no external objects, supports CSV, Parquet and ORC, handles quoted fields correctly, offers automatic schema discovery for Parquet, and writes rejected rows to an error location.
COPY INTO dbo.stg_sales
FROM 'https://stlake.dfs.core.windows.net/raw/sales/2026/11/*.parquet'
WITH (
  FILE_TYPE = 'PARQUET',
  CREDENTIAL = (IDENTITY = 'Managed Identity'),
  MAXERRORS = 0
);
Serverless SQL pools do not support COPY INTO; they use external tables and CREATE EXTERNAL TABLE AS SELECT instead. For new dedicated-pool work, COPY INTO should be the default and PolyBase external tables reserved for cases where a persistent query-in-place table is wanted.
16In a real project using Azure Synapse / Synopsys (confirm), how would you apply, test, or troubleshoot PolyBase and COPY command?
Apply. For a finance warehouse that receives several thousand Parquet files a night, the Spark layer writes each table to a dated folder and a pipeline Script activity runs COPY INTO with a wildcard path into a round-robin staging table, followed by a MERGE or CTAS swap into the hash-distributed fact. Credentials use the pool’s managed identity so no storage keys live in code. File sizes are kept between roughly 100 MB and 1 GB because COPY parallelism is per file.
Test. Each load is wrapped in a validation that compares @@ROWCOUNT from the COPY with a manifest count written by Spark, and checks that the ERRORFILE location is empty. In the test environment I deliberately feed a file with a bad date and a mismatched column count to confirm that MAXERRORS and the rejection path behave as designed rather than silently truncating.
Troubleshoot. Cannot bulk load because the file could not be opened means the pool identity lacks Storage Blob Data Reader or the storage firewall blocks the pool; checking the storage diagnostics log confirms which. A load that is slow relative to data volume typically has a few very large files or many tiny ones, visible in sys.dm_pdw_dms_workers; repartitioning the Spark output fixes it. Type conversion errors on CSV are diagnosed from the rejected-row files and fixed by loading as varchar into staging and casting in SQL.
The important consideration is that COPY INTO is only for dedicated pools, so the same ingestion design cannot be lifted onto serverless.
17Explain columnstore indexes in the context of Azure Synapse / Synopsys (confirm).
A clustered columnstore index (CCI) is the default and preferred storage format for tables in a dedicated SQL pool. Instead of storing rows together, it stores each column separately in compressed segments of up to about 1,048,576 rows called rowgroups. Analytical queries that read a few columns from billions of rows touch only those columns’ segments, and compression ratios of ten times or more are common.
Rows arrive first in an uncompressed delta store rowgroup; once it reaches the row threshold the tuple mover compresses it into a columnstore rowgroup. Bulk loads that insert more than 102,400 rows per distribution go straight to compressed rowgroups, which is why batch loading beats trickle inserts. The lifecycle is shown below.
dot digraph G { rankdir=LR; node [shape=box, style="rounded,filled", fillcolor="#EEF2F7", color="#1F3A5F", fontname="Inter", fontsize=10, margin="0.18,0.08"]; edge [color="#4A5568", fontname="Inter", fontsize=9, arrowsize=0.7]; small [label="Small insert\n< 102,400 rows"]; bulk [label="Bulk load\n>= 102,400 rows"]; delta [label="Delta store\nOPEN rowgroup", fillcolor="#F6E7D8"]; closed[label="CLOSED\nrowgroup"]; comp [label="COMPRESSED\nrowgroup", fillcolor="#E6EFE8"]; small -> delta -> closed [label="1M rows"]; closed -> comp [label="tuple mover"]; bulk -> comp [label="direct"]; } Segment elimination lets the engine skip rowgroups whose min/max metadata excludes the filter value, which works best when data is loaded in sorted order on a commonly filtered column, and ordered CCIs make that ordering explicit.
Alternatives exist for specific cases: a heap for staging tables that are loaded and read once, and a clustered rowstore index with nonclustered indexes for small tables or highly selective point lookups where columnstore overhead is wasted.
Interview takeaway: the quality of a CCI depends on rowgroup health; many small or open rowgroups mean poor compression and slow scans, so monitoring and rebuilding them is part of normal operations.
18In a real project using Azure Synapse / Synopsys (confirm), how would you apply, test, or troubleshoot columnstore indexes?
Apply. In a payments warehouse all fact tables are CCI, partitioned by month and loaded once a day in batches far above the 102,400-row threshold so rows compress immediately. The transaction fact uses an ordered CCI on transaction_date because almost every report filters a date range. Small lookup tables stay as clustered rowstore, and the daily staging table is a heap that is truncated after each load.
Test. A rowgroup health query runs after every load and fails the pipeline if more than a few percent of rows sit in open or small compressed rowgroups.
SELECT t.name, rg.state_desc, COUNT(*) AS rowgroups,
       AVG(rg.total_rows) AS avg_rows
FROM sys.pdw_nodes_column_store_row_groups AS rg
JOIN sys.pdw_nodes_tables AS nt
  ON rg.object_id = nt.object_id AND rg.pdw_node_id = nt.pdw_node_id
JOIN sys.pdw_table_mappings AS tm ON nt.name = tm.physical_name
JOIN sys.tables AS t ON tm.object_id = t.object_id
GROUP BY t.name, rg.state_desc;
Query performance tests compare segment reads before and after a change using sys.dm_pdw_request_steps row counts.
Troubleshoot. Many small rowgroups usually come from loads under memory pressure, where the engine trims rowgroups early; raising the resource class of the loading user or using a workload group with more memory fixes new loads, and ALTER INDEX ... REBUILD on the affected partition repairs existing ones. Poor segment elimination after a backfill means rows arrived unsorted, so I reload the partition through CTAS with ORDER BY.
One common mistake is running frequent small UPDATE or DELETE statements against a CCI, which leaves deleted rows in place and fragments rowgroups until a rebuild.
19Explain partitioning data warehouse tables in the context of Azure Synapse / Synopsys (confirm).
Table partitioning in a dedicated SQL pool splits a table horizontally on one column, almost always a date, so that each partition is a separately managed set of rowgroups within each of the 60 distributions. Partitioning serves two purposes: partition elimination lets queries filtered on the partition column skip whole partitions, and partition switching lets a load replace or remove a whole slice of data as a metadata operation instead of a mass DELETE.
Because the table is already divided into 60 distributions, partitioning multiplies the number of physical chunks. A table with 36 monthly partitions has 2,160 chunks, and each needs about a million rows to form well-compressed columnstore rowgroups. Over-partitioning is therefore the classic mistake: a 100-million-row table partitioned by day would never fill a rowgroup. Monthly or quarterly ranges on tables with billions of rows are typical, and anything below a few hundred million rows often does better unpartitioned.
Partitions are defined inline in CREATE TABLE with PARTITION (col RANGE RIGHT FOR VALUES (...)). Managing them means adding boundaries ahead of new data with SPLIT, merging old ones, and using ALTER TABLE ... SWITCH PARTITION to load or archive data atomically.
20In a real project using Azure Synapse / Synopsys (confirm), how would you apply, test, or troubleshoot partitioning data warehouse tables?
Apply. For a five-billion-row sales fact I partition by month on sale_date with RANGE RIGHT, giving about 80 million rows per partition and roughly 1.4 million per distribution-partition, enough for healthy rowgroups. The nightly load restates the current month: the pipeline builds fact_sales_stage with the same schema and distribution, loads the month’s data, then switches it in.
ALTER TABLE dbo.fact_sales_stage SWITCH PARTITION 2
TO dbo.fact_sales PARTITION 2 WITH (TRUNCATE_TARGET = ON);
A monthly maintenance step splits a new boundary one month ahead and switches out partitions older than seven years to an archive table.
Test. Partition elimination is verified with EXPLAIN: the scan step on a date-filtered query should show only the targeted partition’s row estimate. Load testing covers the empty-partition case for SPLIT, because splitting a non-empty partition in a CCI table is slow and used to be blocked. In the test environment I also rehearse the switch with a mismatched schema to ensure the error is caught before production.
Troubleshoot. A switch that fails with a schema or distribution mismatch is corrected by generating the staging DDL from the target’s metadata rather than hand-writing it. Queries that ignore partitions typically wrap the partition column in a function or compare it to a different data type, preventing elimination; rewriting the predicate as a plain range fixes it. Shrinking compression ratios over time point to too many partitions, which sys.pdw_nodes_column_store_row_groups confirms with small rowgroups.
Partition boundaries must be created before data for a new period arrives, or everything lands in the last open range.
21Explain materialized views in the context of Azure Synapse / Synopsys (confirm).
A materialized view in a dedicated SQL pool physically stores the result of a query, like a table, and the engine keeps it synchronised automatically as the base tables change. Unlike a regular view, which re-runs its definition every time, a materialized view returns pre-computed aggregates, and unlike a summary table built by a pipeline, it needs no refresh job and never goes stale.
The optimizer can also use a materialized view transparently: a query against the base tables that matches or is covered by the view’s aggregation is rewritten to read the view, so existing reports speed up without being changed. Views are stored with their own distribution, usually hash on the GROUP BY key.
CREATE MATERIALIZED VIEW dbo.mv_sales_by_month
WITH (DISTRIBUTION = HASH(product_key))
AS
SELECT product_key, DATEPART(year, sale_date) AS yr,
       DATEPART(month, sale_date) AS mon,
       SUM(amount) AS total_amount, COUNT_BIG(*) AS row_cnt
FROM dbo.fact_sales
GROUP BY product_key, DATEPART(year, sale_date), DATEPART(month, sale_date);
Restrictions apply: the definition must include COUNT_BIG(*), only a subset of aggregates is allowed, and MIN / MAX, DISTINCT, subqueries and ORDER BY are not. Maintenance has a cost: every load into the base table also updates the view’s delta, so a pool with many views on a heavily loaded fact slows its loads, and sys.pdw_materialized_view_column_distribution_properties and DBCC PDW_SHOWMATERIALIZEDVIEWOVERHEAD show when a rebuild is needed.
22In a real project using Azure Synapse / Synopsys (confirm), how would you apply, test, or troubleshoot materialized views?
Apply. In a subscription-billing warehouse the heaviest dashboards aggregate a two-billion-row invoice-line fact by month, plan and region. Rather than altering the Power BI model, I create two materialized views covering those grains and hash-distribute them on the key the dashboards slice by. The views are created after the initial historical load, not before, so the base data does not pay the maintenance cost during the bulk load.
Test. Confirming the optimizer actually uses the view is the key test: EXPLAIN on the original dashboard query should reference the mv_ object in the plan. If it does not, I compare column expressions exactly, because a CAST or different DATEPART form in the query prevents matching. I also measure load duration for the fact table before and after adding the views so the overhead is known and accepted.
Troubleshoot. When dashboards slow down weeks after go-live, DBCC PDW_SHOWMATERIALIZEDVIEWOVERHEAD typically shows a high overhead ratio because incremental changes have accumulated; ALTER MATERIALIZED VIEW ... REBUILD resets it, and I schedule that rebuild weekly in the maintenance pipeline. A view that becomes disabled after a TRUNCATE or a partition switch on the base table must be rebuilt explicitly, which is easy to miss and shows as the optimizer silently reverting to the base tables.
The trade-off to state is that materialized views are a dedicated-pool feature only; in serverless, the equivalent is a pre-aggregated Parquet or Delta table written by Spark.
23Explain workload management in the context of Azure Synapse / Synopsys (confirm).
Workload management controls how a dedicated SQL pool shares its fixed resources, CPU, memory and concurrency slots, among competing requests. Without it, a single analyst running a large ad-hoc query can starve the ETL load or the dashboard refresh. Three objects implement it:
- Workload groups reserve a minimum percentage of resources, cap the maximum, set how much memory each request receives (
REQUEST_MIN_RESOURCE_GRANT_PERCENT), and define query timeouts and importance. - Workload classifiers route incoming requests to a group based on login, role membership, session label, context info, or time of day.
- Importance (low to high) decides which queued request runs first when slots become available.
The older mechanism, resource classes such as largerc, is still present as a set of built-in groups but is superseded by custom workload groups.
CREATE WORKLOAD GROUP wg_etl
WITH (MIN_PERCENTAGE_RESOURCE = 40, CAP_PERCENTAGE_RESOURCE = 80,
      REQUEST_MIN_RESOURCE_GRANT_PERCENT = 10);

CREATE WORKLOAD CLASSIFIER wc_etl
WITH (WORKLOAD_GROUP = 'wg_etl', MEMBERNAME = 'etl_loader',
      IMPORTANCE = HIGH);
Memory per request also influences columnstore quality during loads, so the ETL group typically gets a larger grant than interactive users.
24In a real project using Azure Synapse / Synopsys (confirm), how would you apply, test, or troubleshoot workload management?
Apply. For a pool shared by nightly ETL, Power BI refreshes and about thirty analysts, I define three groups: wg_etl with a 40 percent reservation and large per-request grants, wg_bi with a 30 percent reservation and high importance for the refresh service principal, and wg_adhoc capped at 30 percent with a 20-minute query timeout. Classifiers key on the login for service accounts and on a session label set by the analyst tooling for ad-hoc queries, so a dashboard refresh is never queued behind an exploratory join.
Test. I simulate the busiest hour: a load test tool issues the dashboard query set at expected concurrency while a scripted ETL load runs, and sys.dm_pdw_exec_requests is sampled to confirm that requests land in the intended group (group_name column) and that wg_bi requests are not suspended. Timeout behaviour is tested by running a deliberately slow query under wg_adhoc and checking it is cancelled.
Troubleshoot. When a request sits in Suspended state, sys.dm_pdw_resource_waits shows what it is waiting for, usually concurrency slots or memory held by another group. If the ETL group’s requests are starved, a reservation that is too small or a classifier that matched the wrong rule is the cause; classifier precedence (user match beats role match, labels add weight) explains most routing surprises. Loads producing small rowgroups point to an insufficient resource grant.
Reservations are only honoured when the pool is sized for them, so scaling down the DWU level without revisiting the groups breaks the assumptions.
25Explain serverless external tables in the context of Azure Synapse / Synopsys (confirm).
An external table in the serverless SQL pool is a schema definition that points at files in the data lake. The table stores no data; a query reads the Parquet, Delta or CSV files at the specified location and projects them through the declared columns. Creating one requires three objects: an external data source (the storage URL and optionally a credential), an external file format (Parquet, Delimited, or Delta), and the table itself with its LOCATION.
CREATE EXTERNAL DATA SOURCE lake
WITH (LOCATION = 'https://stlake.dfs.core.windows.net/curated');

CREATE EXTERNAL FILE FORMAT parquet_fmt
WITH (FORMAT_TYPE = PARQUET);

CREATE EXTERNAL TABLE dbo.ext_orders (
  order_id BIGINT, customer_id INT, amount DECIMAL(18,2), order_date DATE
)
WITH (LOCATION = 'orders/', DATA_SOURCE = lake, FILE_FORMAT = parquet_fmt);
External tables give BI tools a conventional object to connect to, with column types and permissions, instead of ad-hoc OPENROWSET calls. They come in two flavours: Hadoop-style tables created by the user, and native tables, which perform better and are now the recommended type in serverless. CREATE EXTERNAL TABLE AS SELECT additionally writes query results back to the lake as Parquet. One limitation versus OPENROWSET is that external tables cannot use filepath() or filename() for partition pruning, which is why views over OPENROWSET are often preferred for large partitioned folders.
26In a real project using Azure Synapse / Synopsys (confirm), how would you apply, test, or troubleshoot serverless external tables?
Apply. For a marketing analytics team I create a serverless database gold whose objects mirror the curated Delta folders written by Spark. Dimension-sized tables are external tables for simplicity; large partitioned facts are exposed as views over OPENROWSET with filepath() predicates so partition folders are pruned. Analysts connect from Power BI with their Entra identity, and the database-scoped credential uses managed identity so nobody handles storage keys. CETAS writes monthly snapshot Parquet files for external vendors.
Test. Type fidelity is the first thing I verify: a Parquet decimal(38,10) or a timestamp with timezone silently loses precision if the external table declares a narrower type, so a test query compares aggregates from Spark and serverless on the same folder. Cost is tested by running each report with SET STATISTICS IO -equivalent monitoring, namely checking data_processed_mb in sys.dm_exec_requests_history, and files are compacted until a typical query scans well under a gigabyte.
Troubleshoot. Content of directory cannot be listed or File cannot be opened is a permission problem: the querying user’s Entra identity needs ACLs on the folder tree and execute on every parent folder, or the credential must be switched to managed identity. Queries that return wrong row counts after Spark writes are usually reading Delta parts as plain Parquet; the file format must be DELTA so the transaction log is honoured. A sudden jump in cost after a schema change tends to mean Spark wrote many small files, which OPTIMIZE resolves.
External table statistics are not created automatically in serverless, so join-heavy queries benefit from CREATE STATISTICS on the key columns.
27Explain data lake security and ACLs in the context of Azure Synapse / Synopsys (confirm).
Securing data in ADLS Gen2 for Synapse combines three layers that are evaluated in order: network restrictions on the storage account, Azure RBAC roles on the account or container, and POSIX-style access control lists (ACLs) on individual directories and files.
- Network: the storage firewall limits access to selected virtual networks, private endpoints or trusted Azure services; Synapse reaches it through managed private endpoints or the “allow trusted Microsoft services” exception.
- RBAC: data-plane roles such as
Storage Blob Data ReaderorStorage Blob Data Contributorgrant coarse access to everything in the scope. If RBAC grants access, ACLs are not checked. - ACLs: each directory and file carries read, write and execute bits for owner, group, named users or groups, and others. Traversing a path requires execute on every parent folder; listing or reading a file requires read on the file and execute on its directory. Default ACLs on a folder are inherited by new children only.
Synapse identities that need securing are the workspace managed identity (used by pipelines, dedicated pool COPY and Spark job runs), individual Entra users (serverless queries and notebooks pass the caller’s token through), and any service principals used by external tools. Best practice is to grant RBAC only to platform identities, use Entra security groups rather than named users in ACLs, and apply default ACLs at the zone root (raw, curated, gold) before data arrives.
28In a real project using Azure Synapse / Synopsys (confirm), how would you apply, test, or troubleshoot data lake security and ACLs?
Apply. For a healthcare analytics lake I define groups per zone and purpose: g-lake-raw-writers (the workspace managed identity only), g-lake-curated-readers (data engineers and the serverless pool consumers), g-lake-gold-analysts. The workspace identity gets Storage Blob Data Contributor at the container level because pipelines need to create folders anywhere. Human users receive no RBAC at all, only ACLs: read and execute on gold/, with default ACLs set so new tables inherit permissions, and a restricted gold/phi/ subtree that only a clinical-data group can traverse.
Test. Access is tested with real identities rather than assumptions: a test user from each group runs a serverless OPENROWSET against a folder they should and should not see, and the pipeline asserts the expected success or 403. An ACL audit script walks the tree with az storage fs access show and compares against the intended matrix, flagging named users or others bits. Storage diagnostic logs are enabled so the test leaves an audit trail to review.
Troubleshoot. The most frequent ticket is “I can read the file directly but the folder listing fails”, which means execute is missing on a parent directory. Permissions that work for existing files but fail for files written yesterday mean default ACLs were never set, so the new objects inherited nothing; fixing requires recursive ACL propagation with --recursive or a Spark job for very large trees. Spark notebooks failing while pipelines succeed point to the difference between the user’s token and the managed identity.
Recursive ACL changes over millions of files take hours, so group-based design up front is far cheaper than retrofitting.
29Explain integration with ADLS Gen2 in the context of Azure Synapse / Synopsys (confirm).
ADLS Gen2 is the storage foundation of a Synapse workspace. Every workspace is created with a primary ADLS Gen2 account and filesystem, used for Spark logs, workspace metadata and lake databases, and additional accounts can be attached as linked services. The integration has several faces:
- Serverless SQL reads files directly with
OPENROWSETor external tables overhttps://<account>.dfs.core.windows.net/paths, passing through the caller’s Entra identity or a database-scoped credential. - Dedicated SQL loads from the lake with
COPY INTOor PolyBase and can export with CETAS; its storage is otherwise managed internally. - Spark mounts the lake via the
abfss://container@account.dfs.core.windows.net/pathscheme with built-in Entra pass-through, so no key configuration is needed in notebooks. - Pipelines copy to and from the lake using the
AzureBlobFSlinked service type and the workspace managed identity. - Lake databases store Spark tables as Parquet or Delta in the lake with a shared metastore visible to serverless SQL.
The diagram shows how each engine reaches the lake and which identity it presents.
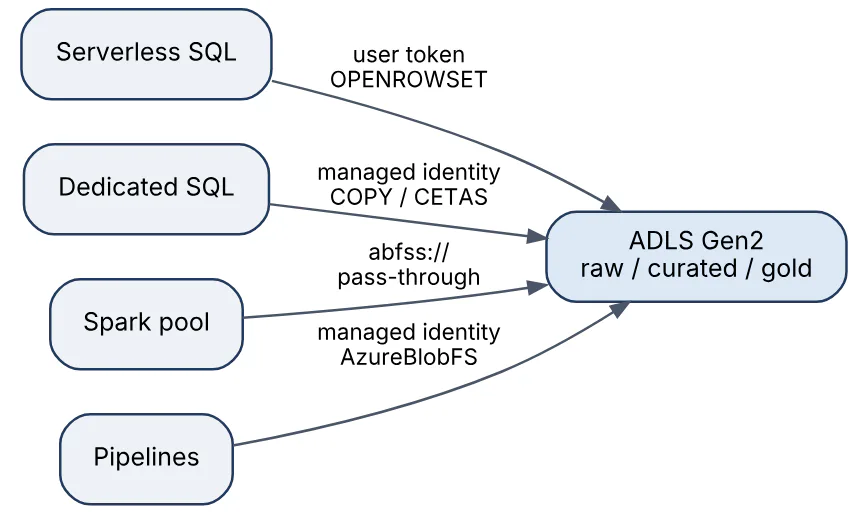
The hierarchical namespace of Gen2 is what makes this work efficiently: real directories allow partition pruning by folder, atomic renames for Spark commits, and directory-level ACLs. Storage events on the account can also fire pipeline triggers, which closes the loop between file arrival and processing.
30In a real project using Azure Synapse / Synopsys (confirm), how would you apply, test, or troubleshoot integration with ADLS Gen2?
Apply. I separate the workspace’s primary account, which holds metadata and logs, from a dedicated data-lake account with containers for raw, curated and gold, each as a filesystem with its own default ACLs. Spark writes Delta with abfss:// paths and a consistent folder convention curated/<domain>/<table>/, serverless views are generated from that convention, and the dedicated pool loads only from gold/. The lake account is locked to private endpoints; the workspace reaches it through managed private endpoints approved on the storage side.
Test. Connectivity from every engine is checked by an environment smoke test: a notebook lists a folder, a serverless query reads one Parquet file, a dedicated-pool COPY loads a ten-row file, and a pipeline Copy writes and deletes a marker file. Performance tests cover the file layout: a table written with 200 MB files versus 5 MB files is queried from serverless and Spark to make the small-file penalty visible to the team.
Troubleshoot. AuthorizationPermissionMismatch in Spark almost always means the user has RBAC on the primary account but not on the data account. Storage firewall misconfiguration surfaces differently per engine, as a timeout in pipelines but a 403 in serverless, so I check the storage account’s network rules and the managed private endpoint approval state first. Delta tables that serverless cannot read after a Spark upgrade are usually caused by a newer Delta protocol feature such as deletion vectors that serverless does not support; disabling that table property fixes it.
Soft delete and versioning on the lake account protect against accidental deletes but increase cost for Delta tables with frequent compaction, so configure retention deliberately.
31Explain Synapse Studio development in the context of Azure Synapse / Synopsys (confirm).
Synapse Studio is the browser-based workspace at web.azuresynapse.net where all development, monitoring and administration happens. It is organised into hubs:
- Data – browse lake databases, dedicated pool databases, linked storage accounts; create tables and preview files.
- Develop – author SQL scripts, notebooks (PySpark, Scala, Spark SQL, .NET), Spark job definitions, data flows and KQL scripts.
- Integrate – design pipelines and triggers with the visual canvas.
- Monitor – view pipeline and trigger runs, Spark applications, SQL requests and integration runtime status.
- Manage – SQL and Spark pools, linked services, integration runtimes, Git configuration, access control, managed private endpoints.
Development artifacts (scripts, notebooks, pipelines, linked services) are JSON documents stored in the workspace. With Git integration enabled, the Studio works against a feature or collaboration branch, and “Publish” generates the workspace’s live definition into a workspace_publish branch as an ARM-style template. Without Git, changes are saved straight to the live service, which is acceptable only for sandboxes.
Notebooks support cell-level language magics, parameter cells for pipeline integration, inline charts over DataFrames, and session-level configuration of pool resources. Studio is a thin client; everything it does is also exposed through the Synapse REST API, Azure CLI (az synapse) and PowerShell, which is how automation reaches the same artifacts.
32In a real project using Azure Synapse / Synopsys (confirm), how would you apply, test, or troubleshoot Synapse Studio development?
Apply. Only the dev workspace has Git integration enabled and developers work in it; test and prod workspaces are read-only targets fed by the release pipeline. Each engineer works in a feature branch inside Studio, and the pull request to the collaboration branch is the review gate. Notebooks are written with a parameters cell at the top so the same notebook runs interactively with sample paths and from a pipeline with production paths. Shared helper code is not copied between notebooks; it is packaged as a wheel and attached to the pool.
Test. Studio’s Debug on pipelines and “Run all” on notebooks give fast feedback, but the real tests live outside the UI: notebooks are exported and executed by a CI job that validates them against fixtures, and SQL scripts are run through sqlcmd against the test pool. Reviewers check the artifact JSON diff in the pull request for accidental environment-specific values, which Studio makes easy to introduce.
Troubleshoot. “Publish failed” after merging a branch usually means a renamed artifact left dangling references in a pipeline; the error names the dependent object. A Studio session that cannot start a Spark session reports the pool is at capacity or the user lacks the Synapse Compute Operator role. Lost edits typically trace back to someone switching from Git mode to live mode, which discards unpublished changes.
The trade-off with Studio is convenience versus discipline: it is easy to make a hotfix in production, so role assignments should make the prod workspace read-only for humans.
33Explain managed private endpoints in the context of Azure Synapse / Synopsys (confirm).
A managed private endpoint is a private endpoint that Synapse creates on the customer’s behalf inside the managed virtual network of the workspace. When a workspace is created with a managed VNet, all Spark pools and pipeline integration runtime compute run in a network that Microsoft owns and isolates per workspace. Those resources then have no public route to data sources, so managed private endpoints provide the outbound private links to storage accounts, Azure SQL, Key Vault, Cosmos DB and other PaaS services.
The flow is: create the managed private endpoint in Studio’s Manage hub, the target resource shows a pending private endpoint connection, the resource owner approves it, and traffic from Spark and pipelines to that resource now travels over the Microsoft backbone to a private IP. The target service can then disable all public access. The diagram shows the resulting path.
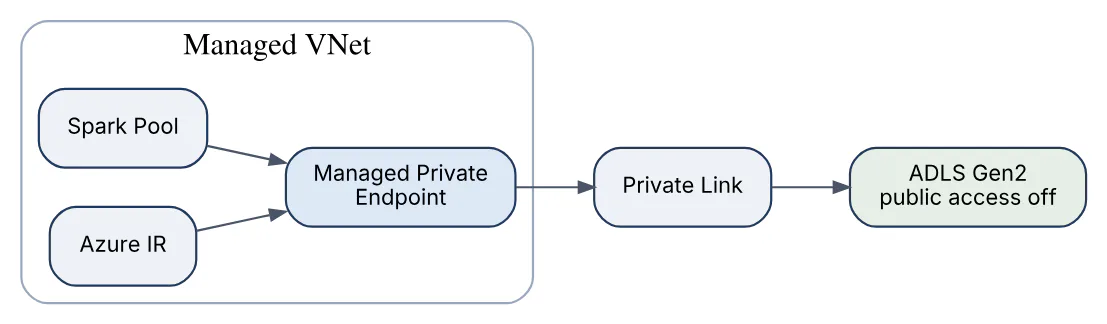
Managed private endpoints protect the outbound direction only. Inbound access to the workspace’s own endpoints (SQL, SQL on-demand, Dev) is secured separately with regular private endpoints created in the customer’s VNet via a private link hub. Data exfiltration protection, an option set at workspace creation, goes further by blocking any outbound traffic that does not use an approved managed private endpoint.
34In a real project using Azure Synapse / Synopsys (confirm), how would you apply, test, or troubleshoot managed private endpoints?
Apply. In a regulated banking project the workspace is created with a managed VNet and data exfiltration protection enabled, which is a creation-time decision that cannot be changed later. Managed private endpoints are created for the lake account (both dfs and blob sub-resources, because Spark and pipelines use different ones), the Key Vault, and the source Azure SQL databases, with approvals automated in the infrastructure pipeline through Bicep and an approval step run by the resource owner’s service principal. Inbound connectivity for analysts comes through a private link hub and private endpoints into the corporate VNet.
Test. After deployment every endpoint’s status is checked with az synapse managed-private-endpoints show until it reads Approved, and the environment smoke test runs a Spark read and a pipeline Copy with the storage account’s public access set to disabled, proving traffic uses the private path. A negative test attempts a Spark call to a public internet URL and confirms it is blocked when exfiltration protection is on.
Troubleshoot. A pipeline that times out while Spark succeeds, or vice versa, usually means only one of the dfs or blob endpoints was created. An endpoint stuck in Pending has not been approved on the target resource. Spark sessions that fail to install libraries from PyPI under exfiltration protection need a private package feed or a pre-built pool library instead. DNS is not a concern for managed endpoints, since Synapse manages resolution inside the managed VNet, which rules out a common red herring.
Managed private endpoints are not available for serverless or dedicated SQL pool outbound traffic to storage; those rely on the storage firewall’s trusted-service and resource-instance rules.
35Explain Spark SQL integration in the context of Azure Synapse / Synopsys (confirm).
Spark SQL integration in Synapse covers two things: using SQL inside Spark, and sharing data between the Spark and SQL engines.
Inside a Spark pool, %%sql cells and spark.sql() run ANSI-style SQL over DataFrames and tables, with Delta Lake extensions such as MERGE INTO and OPTIMIZE. Tables created with CREATE TABLE or saveAsTable go into a lake database, whose metadata is synchronised to the serverless SQL pool automatically: a Delta or Parquet table saved from Spark appears as an external table in a serverless database of the same name, queryable with T-SQL by Power BI without any extra DDL. Permissions follow the underlying files, so lake ACLs govern both engines.
Exchange with a dedicated SQL pool uses the Azure Synapse Dedicated SQL Pool Connector for Spark (synapsesql), which moves data in bulk through the lake staging area with PolyBase or COPY under the covers rather than row by row over JDBC.
path = "abfss://curated@stlake.dfs.core.windows.net/orders"
df = spark.read.format("delta").load(path)

(df.write
   .option(Constants.SERVER, "ws-prod.sql.azuresynapse.net")
   .synapsesql("dw.dbo.fact_orders", Constants.INTERNAL))
The connector authenticates with the user’s Entra token or the managed identity, and reading in the other direction with spark.read.synapsesql("dw.dbo.dim_customer") is equally supported. Lake database tables are not visible to the dedicated pool, which is the one asymmetry worth remembering.
36In a real project using Azure Synapse / Synopsys (confirm), how would you apply, test, or troubleshoot Spark SQL integration?
Apply. In an e-commerce platform the Spark notebooks build curated Delta tables in a lake database named sales, and the analytics team queries them immediately through the serverless sales database with no handover step. Only the aggregated gold tables that back the executive dashboards are pushed into the dedicated pool with the synapsesql connector from the final notebook of the pipeline, replacing a previous design that exported CSV and ran COPY INTO in a separate activity.
Test. Schema parity is tested every run: a notebook compares the Spark table schema to the serverless INFORMATION_SCHEMA.COLUMNS output and alerts when a type maps unexpectedly, such as Spark timestamp becoming datetime2(7) or a string arriving as varchar(8000). Connector writes are tested for idempotency by running the pipeline twice and asserting the dedicated table row count is unchanged. Load tests record how long the connector takes versus the staged COPY baseline.
Troubleshoot. Tables missing from serverless after a Spark run usually mean the table was created as a temporary view or in the Spark default database using a path outside the workspace’s primary storage. Connector failures with Access denied on the staging folder point to the dedicated pool’s managed identity lacking rights on the temporary data location; setting Constants.TEMP_FOLDER to a folder it can access resolves it. Serverless reporting stale data after Delta MERGE indicates the table is read as Parquet rather than Delta.
Metadata sync is one-directional, Spark to serverless, so objects created in T-SQL do not appear in Spark.
37Explain pipeline triggers and parameterization in the context of Azure Synapse / Synopsys (confirm).
Triggers start pipeline runs without a human pressing Run, and parameters make one pipeline definition serve many inputs. Four trigger types exist:
| Trigger | Fires when | Typical use |
|---|---|---|
| Schedule | Wall-clock recurrence, cron-like | Nightly loads at 02:00 |
| Tumbling window | Fixed, non-overlapping windows, with retry and backfill | Hourly incremental loads that must not skip a window |
| Storage event | Blob created or deleted in a container path | Process a file when a partner drops it |
| Custom event | Event Grid topic message | Downstream of another system’s completion |
A tumbling window trigger exposes @trigger().outputs.windowStartTime and windowEndTime, which flow into pipeline parameters so every run knows exactly which slice of data it owns, and the trigger tracks each window’s state so missed windows are re-run. Storage event triggers surface @triggerBody().folderPath and fileName.
Parameters exist at three levels: pipeline parameters (read-only inputs supplied by the trigger or a parent pipeline), variables (mutable within a run), and dataset or linked service parameters bound from activity settings. Expressions use the pipeline expression language, for example @formatDateTime(pipeline().parameters.windowStart, 'yyyy/MM/dd') to build a folder path. Global parameters and the deployment-time parameter template handle environment-specific values such as storage URLs.
38In a real project using Azure Synapse / Synopsys (confirm), how would you apply, test, or troubleshoot pipeline triggers and parameterization?
Apply. For an hourly telemetry feed I use a tumbling window trigger with a one-hour window, a 15-minute delay to let late files land, and three retries. The pipeline receives windowStart and windowEnd parameters, builds the source path from them, and passes them to the Spark notebook so the Delta MERGE is scoped to that hour. A single generic pl_ingest_table pipeline is called by a parent with a table name and watermark column, so adding a source is a control-table row. Partner file drops use a storage event trigger filtered on .csv suffix in landing/partner-x/.
Test. Parameter handling is tested with Debug runs that pass explicit boundary values, including a window spanning midnight and a month end, because date-formatting expressions are where bugs hide. Backfill is tested by creating the trigger with a start date a week in the past in the test workspace and confirming the windows run in order and in parallel up to the maxConcurrency setting. Event triggers are tested by uploading a sample file and checking the run appears in Monitor with the expected folderPath.
Troubleshoot. A trigger that never fires is usually not started after publish, since triggers deploy in a stopped state unless the release pipeline starts them. Storage event triggers silently fail when the Event Grid resource provider is not registered in the subscription. Runs processing the wrong hour point to time zone confusion between the trigger (UTC) and the source folder convention; standardising on UTC in paths avoids it.
Tumbling window triggers are bound to one pipeline and cannot be re-pointed, so the pipeline name should be stable before the trigger is created.
39Explain query performance tuning in the context of Azure Synapse / Synopsys (confirm).
Tuning a dedicated SQL pool query is mostly about reducing data movement and reading fewer, better-compressed segments; tuning serverless is mostly about scanning fewer bytes. The main levers in the dedicated pool:
- Distribution alignment – join and aggregate on the hash key so steps run without shuffle or broadcast.
- Statistics – create and update statistics on join, filter and group columns; the optimizer’s plan quality depends on them, and auto-create covers only part of the need.
- Columnstore health – well-compressed rowgroups and ordered CCIs enable segment elimination.
- Partition elimination – plain range predicates on the partition column.
- Materialized views and result-set caching – pre-aggregate hot paths; result-set caching returns repeated identical queries instantly.
- Right-sized resources – a larger workload group grant or DWU level for memory-hungry joins.
The diagnostic path starts with EXPLAIN or the actual steps in sys.dm_pdw_request_steps, looking at operation types and row counts per step; a ShuffleMoveOperation with hundreds of millions of rows is the signature problem. sys.dm_pdw_sql_requests then shows whether one distribution is far slower than the others, indicating skew.
In serverless, the equivalents are partition pruning via filepath(), Parquet or Delta instead of CSV, files in the 100 MB to 1 GB range, selecting only needed columns, and manually created statistics on external tables. In both engines, the Query Store-like history in sys.dm_pdw_exec_requests provides the baseline to prove an improvement.
40In a real project using Azure Synapse / Synopsys (confirm), how would you apply, test, or troubleshoot query performance tuning?
Apply. Tuning is driven by the workload, not by individual complaints. For a retail pool I capture every request with its label, duration and resource class from sys.dm_pdw_exec_requests into a history table nightly, rank the top twenty by total time, and fix those first. Dashboard queries get a OPTION (LABEL = 'dash_sales_region') hint so they can be found and compared across releases. Statistics maintenance runs after each load on the columns the plan analysis shows as join and filter keys.
Test. Each tuning change is measured on a quiet pool with result-set caching turned off for the session (SET RESULT_SET_CACHING OFF) so the figure reflects compute, then re-tested under the concurrency load script. The acceptance criterion is a step-level change, for example “shuffle step rows fall from 400 M to 0”, not only wall-clock time, because the latter varies with pool load.
SELECT step_index, operation_type, row_count, total_elapsed_time
FROM sys.dm_pdw_request_steps
WHERE request_id = 'QID12345'
ORDER BY step_index;
Troubleshoot. A query that is slow only sometimes points to concurrency or caching rather than the plan, which the workload group’s queue metrics confirm. A query that got slower after a load usually has stale statistics; DBCC SHOW_STATISTICS reveals the row count it believes versus reality. Plans with a BroadcastMoveOperation on a table larger than a few GB indicate a wrong cardinality estimate, fixed with statistics or by making the join key the distribution key.
The main trap is tuning for a single query at the expense of the design: redistributing a fact table to help one report can shuffle twenty others.
41Explain cost control pausing pools in the context of Azure Synapse / Synopsys (confirm).
Dedicated SQL pools are billed per hour for the provisioned DWU level whenever they are online, regardless of how many queries run, so pausing is the single largest cost lever. A paused pool stops compute billing entirely while storage continues to be charged at a flat per-TB rate; resuming takes a few minutes and all data, tables and permissions are intact. Pausing requires that no load or transaction is in flight, and in-progress queries are cancelled.
Spark pools do not pause; they auto-pause by shutting down the cluster after a configurable idle time, and they bill per vCore-hour only while nodes are up. Serverless SQL has no idle cost at all.
Common controls:
- Schedule pause and resume around the business day with a pipeline or Azure Automation runbook, and scale down to a lower DWU for off-peak loads.
- Set Spark pool auto-pause to 10–15 minutes for development pools and use small minimum node counts.
- Put Azure Cost Management budgets and alerts on the resource group.
- Use serverless for rarely queried data instead of keeping it in the dedicated pool.
az synapse sql pool pause --name dwprod --workspace-name ws-prod \
  --resource-group rg-analytics
az synapse sql pool resume --name dwprod --workspace-name ws-prod \
  --resource-group rg-analytics
A pool paused for 12 hours a day and all weekend costs roughly a third of one left running continuously.
42In a real project using Azure Synapse / Synopsys (confirm), how would you apply, test, or troubleshoot cost control pausing pools?
Apply. For a mid-sized finance warehouse used in office hours I run a pipeline at 01:00 that resumes the pool at DW1000c, runs the loads, scales down to DW300c for the business day at 07:00, and pauses at 20:00 and all weekend. The resume and pause are Web activities against the Synapse REST API using the workspace managed identity, wrapped in an Until loop that polls the pool state. Spark development pools have 10-minute auto-pause and a two-node minimum; the job pool has a three-node minimum and scales to 20.
Test. The schedule is validated first in the test subscription by checking the Cost Management daily export for the expected drop on paused hours. Resume reliability is tested by timing a hundred resume calls and feeding the worst case into the pipeline’s buffer before the first load. I also test what the BI tool does when it hits a paused pool: Power BI import refreshes should run after resume, and DirectQuery reports must not be pointed at a pausable pool.
Troubleshoot. A pause call that fails with a conflict means a query or load is still running, which the Until loop handles by waiting; a pause that keeps failing points to a connection pool or scheduled refresh holding the pool busy, which the DMVs identify. Bills that stay high after scheduling pauses usually come from a scale operation that failed and left the pool at the high DWU, or from Spark pools whose auto-pause was turned off by a developer.
The important consideration is that pausing cancels in-flight work and clears caches, so pools with 24-hour query SLAs or heavy adaptive-cache reliance should be scaled down instead of paused.
43Explain CI/CD with Synapse artifacts in the context of Azure Synapse / Synopsys (confirm).
Synapse workspace artifacts (pipelines, notebooks, SQL scripts, linked services, triggers, Spark job definitions) are JSON and are source-controlled through the workspace’s Git integration with Azure DevOps or GitHub. Development happens in a Git-connected workspace on feature branches; merging into the collaboration branch and clicking Publish generates TemplateForWorkspace.json and a parameters file in the workspace_publish branch. Those templates are the deployable unit for test and production workspaces, which are not Git-connected.
Deployment uses the Synapse workspace deployment task (Azure DevOps extension or GitHub Action), which takes the template, substitutes an environment-specific parameters file (storage URLs, Key Vault names, SQL endpoints), stops triggers, applies the artifacts through the Synapse REST API, and restarts triggers. Infrastructure, meaning the workspace itself, pools, managed private endpoints and RBAC, is deployed separately with Bicep or Terraform before the artifacts.
Dedicated SQL pool schema (tables, views, procedures) is not a workspace artifact and goes through a database project (.sqlproj) built to a DACPAC and deployed with SqlPackage. The diagram shows the two tracks.

Newer pipelines can skip the manual Publish step by building the templates from the collaboration branch with the @azure/synapse npm validate-and-export utility, which allows a pure pull-request-driven flow.
44In a real project using Azure Synapse / Synopsys (confirm), how would you apply, test, or troubleshoot CI/CD with Synapse artifacts?
Apply. The repository holds three folders: infra/ with Bicep for workspaces, pools and private endpoints; workspace/ with the Git-integrated Synapse artifacts; and sql/ with the dedicated pool database project. A pull request to main runs validation (template export, sqlproj build, notebook unit tests); a merge deploys infra, then the DACPAC, then the artifacts to the test workspace, runs the smoke pipeline, and waits for an approval gate before repeating against production. Environment-specific values live only in the parameter files; secrets live in Key Vault referenced by name.
Test. The exported template is diffed against the last release so reviewers see exactly which artifacts change. Post-deployment tests run the smoke pipeline and query az synapse trigger list to confirm every production trigger is started. DACPAC deployment is tested with the /p:BlockOnPossibleDataLoss=true default so a destructive schema change fails in test rather than production.
Troubleshoot. Deployment failures naming a linked service usually mean a parameter such as the Key Vault URL was not overridden, or the parameter template did not expose the property; customising template-parameters-definition.json fixes the latter. A pipeline that works in dev but fails in prod with a permission error points to the prod managed identity missing a role granted manually in dev. Triggers left stopped after a failed release are the most common silent problem, so the release ends with an explicit start step and an alert on stopped triggers.
Spark pool library changes are not artifacts and must be deployed through the pool definition in infra/, or environments drift.
45Explain monitoring failed pipelines in the context of Azure Synapse / Synopsys (confirm).
Pipeline failures are observable at three levels. The Monitor hub in Synapse Studio lists pipeline runs, trigger runs and each activity run with status, duration, input and output JSON and the error message, kept for 45 days. Azure Monitor diagnostic settings export the same data (IntegrationPipelineRuns, IntegrationActivityRuns, IntegrationTriggerRuns categories) to a Log Analytics workspace, storage account or Event Hub, which is what makes long-term retention, cross-workspace queries and alerting possible. Metrics such as failed pipeline run count are available for metric alerts without custom queries.
Inside the pipeline, failure handling is designed with activity dependencies: an activity’s Failure or Completion output can route to a notification activity, and @activity('Copy sales').error.message exposes the error text for the message. A common pattern is a parent pipeline that calls child pipelines with Execute Pipeline and has a single failure branch that posts to Teams or Logic Apps.
SynapseIntegrationPipelineRuns
| where Status == "Failed"
| summarize Failures = count() by PipelineName, bin(TimeGenerated, 1d)
| order by Failures desc
The retention gap matters: a monthly review of failure trends is impossible from Studio alone, so diagnostic settings should be part of workspace provisioning rather than an afterthought.
46In a real project using Azure Synapse / Synopsys (confirm), how would you apply, test, or troubleshoot monitoring failed pipelines?
Apply. Every workspace is provisioned with diagnostic settings sending pipeline, activity, trigger, SQL request and Spark application logs to a central Log Analytics workspace. A standard wrapper pipeline executes each business pipeline and, on failure, calls a Logic App that posts the pipeline name, run ID, failed activity and error message to the on-call Teams channel and opens a ticket. Alert rules in Azure Monitor cover failed runs per pipeline, a tumbling window trigger with no run in the last two hours (missed window), and runs exceeding twice their median duration.
Test. Alerting is tested by deliberately failing a pipeline in the test workspace with a bad path and verifying the Teams message, the ticket and the Log Analytics row arrive within the expected latency, which can be several minutes for diagnostic logs. The duration alert is tested by inserting a Wait activity. Runbooks are reviewed by having a newer team member resolve a simulated failure using only the alert content.
Troubleshoot. Investigation starts from the run ID in the alert: the Monitor hub shows the failing activity and its output JSON, and for Notebook activities the link to the Spark application’s driver log and Spark UI. Recurring transient failures such as source timeouts get activity-level retries; repeated schema-drift failures get a schema validation step before the Copy. A pipeline shown as Succeeded while data is missing indicates a swallowed error in a ForEach, so I check inner activity runs rather than the outer status.
The key consideration is to alert on the business outcome, not only on failures: a pipeline that never triggers produces no failure event, so a missed-window check is essential.
47Explain incremental loading and CDC in the context of Azure Synapse / Synopsys (confirm).
Incremental loading moves only rows that changed since the last run, rather than reloading whole tables. Three mechanisms are used with Synapse:
- Watermark loading – a control table stores the highest
modified_ator identity value loaded; the Copy activity’s source query selects rows above it, and the watermark is updated on success. Simple and source-agnostic, but it cannot see deletes. - Change Data Capture (CDC) – the source database (SQL Server, Azure SQL) records inserts, updates and deletes in change tables; the pipeline reads changes between two LSNs. Synapse pipelines also offer a native CDC source option for SQL sources and a dedicated “Change Data Capture” resource that polls sources on a schedule and writes changes to the lake.
- Change feed / event streams – Cosmos DB change feed, Debezium into Event Hubs, or storage change feed, processed by Spark Structured Streaming.
Applying the changes on the Synapse side is where the engines differ. In the lake, Spark MERGE INTO a Delta table handles inserts, updates and deletes in one statement. In the dedicated pool, changes land in a staging table and a T-SQL MERGE or the insert-update-delete trio applies them; dedicated pool MERGE is generally available but historically carried restrictions, so many teams still use the explicit statements. The diagram shows the common CDC path.
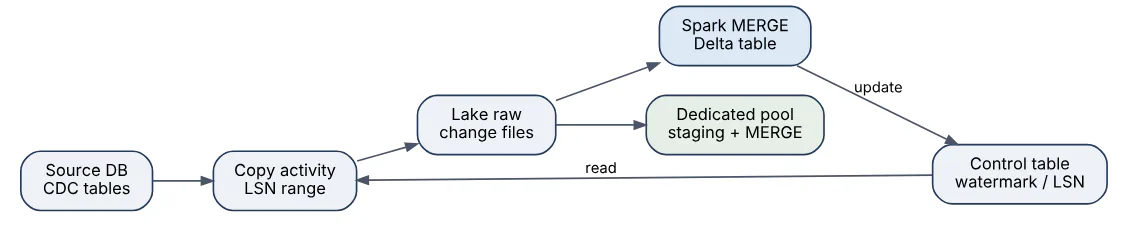
Hard deletes and late-arriving updates are the reason to prefer CDC over watermarks when the source supports it.
48In a real project using Azure Synapse / Synopsys (confirm), how would you apply, test, or troubleshoot incremental loading and CDC?
Apply. For an order-management system on Azure SQL I enable CDC on the twelve tables that feed the warehouse. A tumbling window pipeline runs every 15 minutes, reads sys.fn_cdc_get_net_changes_* between the LSNs matching the window, lands the changes as Parquet under raw/oms/<table>/<window>/, and a notebook applies them with a Delta MERGE keyed on the primary key, honouring __$operation so deletes are applied or soft-deleted. The LSN high-water mark is written to the control table only after the merge commits, inside the same pipeline run.
Test. Correctness is tested with a reconciliation notebook that compares a full snapshot of the source with the Delta table every night: row counts, a hash of business columns, and a list of mismatched keys. Specific scenarios are scripted in the test source: insert then update within one window, update then delete, and a late-arriving row with an old timestamp, each verified to produce exactly one correct final state. Replay is tested by re-running a window and confirming the merge is idempotent.
Troubleshoot. Missing changes usually trace to the CDC cleanup job retention (default three days) having purged change tables after an outage, which needs a full reload of the affected table and a longer retention. Duplicate rows after a retry indicate the watermark was advanced before the merge finished, so the order of activities is corrected. Slow merges on large Delta tables are caused by rewriting too many files; partitioning the target by a column present in the changes and Z-ordering on the key limits the rewrite.
The main consideration is that the source CDC retention window is the recovery budget, so alerting on pipeline gaps must fire well inside it.
49Explain warehouse migrations in the context of Azure Synapse / Synopsys (confirm).
A warehouse migration to Synapse moves schema, data, ETL and consumers from a legacy platform such as Teradata, Netezza, Oracle Exadata, SQL Server or an on-premises Hadoop warehouse into a dedicated SQL pool and the lake. Microsoft publishes platform-specific migration guides and the Azure Synapse Pathway tool translates DDL and SQL from Teradata, Netezza, Snowflake and SQL Server into T-SQL for the dedicated pool.
Migration happens in phases:
- Assess – inventory objects, query workloads and dependencies; classify what is dead, what is lift- and-shift, and what should be redesigned.
- Schema conversion – map data types, replace unsupported features (sequences, triggers, certain constraints), choose distribution, index and partition strategy for each table.
- Data migration – export to Parquet in ADLS Gen2 with Data Factory or native unload utilities, then
COPY INTO; historical data first, then delta catch-up. - ETL and consumer migration – rebuild jobs as pipelines, Spark or stored procedures; repoint BI tools.
- Validate and cut over – run both platforms in parallel, reconcile, then switch.
Several Synapse specifics shape the target design: no primary key enforcement (constraints are NOT ENFORCED), 60 distributions instead of the source’s hashing scheme, columnstore as default storage, limited MERGE semantics, and the choice of putting cold or semi-structured data in the lake under serverless rather than in the dedicated pool at all.
Because Microsoft now directs new analytics investment towards Microsoft Fabric, a migration started today should weigh targeting Fabric Warehouse directly or designing the Synapse landing zone (Delta in the lake, minimal pool-specific features) so a later move to Fabric is straightforward.
50In a real project using Azure Synapse / Synopsys (confirm), how would you apply, test, or troubleshoot warehouse migrations?
Apply. Migrating a 40 TB Teradata warehouse for a utility company, I ran Pathway over the DDL and views to get a first T-SQL draft, then reviewed every large table’s distribution against the top 100 query joins exported from Teradata’s DBQL. Historical data was unloaded to Parquet in monthly files, copied to ADLS Gen2 with a self-hosted integration runtime, and loaded with COPY INTO into partitioned CCI tables. BTEQ scripts became stored procedures orchestrated by pipelines, and the two platforms ran in parallel for six weeks with daily CDC catch-up.
Test. Reconciliation is automated: for each table, row counts, SUM of numeric columns, MIN / MAX of dates and a sampled row-level hash are compared between source and target and stored with a pass/fail flag. The top reports are executed on both platforms and result sets diffed to the cent, which catches numeric precision and NULL handling differences. Performance acceptance uses the same report set under the agreed concurrency.
Troubleshoot. Query-result differences most often come from implicit type conversion and rounding rules, DECIMAL precision defaults, or case-sensitive collation on the source; explicit casts and the right database collation resolve them. Queries that were fast on Teradata and slow on Synapse nearly always involve a join key not aligned with the chosen distribution, found via sys.dm_pdw_request_steps shuffle rows. Load failures on COPY INTO with Parquet typically stem from Teradata TIMESTAMP(6) or unbounded VARCHAR types that need explicit target widths.
The main consideration is scope discipline: redesigning everything during a migration doubles the risk, so lift-and-shift with a short list of planned improvements is the usual recommendation, with deeper modernisation, possibly straight into Fabric, as a follow-on phase.
Answers tailored to your resume and job description
Add your resume and the job description in CrackItX's Settings. When the interviewer asks a Azure Synapse Analytics question, Claude suggests an answer using your real projects and the role's requirements, in real time.
See pricing →