Top 50 Databricks
interview questions
Lakehouse, Delta Lake, Unity Catalog, jobs and optimisation. Open a question to read the answer.
01Explain Databricks workspace architecture in the context of Databricks.
A Databricks workspace is split into two planes. The control plane is run by Databricks in its own cloud account: the web UI, REST APIs, notebooks, job scheduler, Unity Catalog metastore and cluster manager live there. The compute plane is where Spark actually runs and where your data lives. For classic compute, it is deployed into your own cloud account (a VNet/VPC you control); for serverless compute, Databricks hosts it in a network-isolated environment inside the Databricks account, while data still stays in your storage.
Key points:
- Data never has to leave your cloud storage (ADLS Gen2 or S3); clusters read it directly using Unity Catalog storage credentials.
- Notebook results, job metadata and configuration are stored in the control plane; secure cluster connectivity means the compute plane needs no inbound public ports.
- One Databricks account can hold many workspaces (dev, test, prod) sharing a single account-level Unity Catalog metastore per region.
This diagram shows how the pieces are placed.
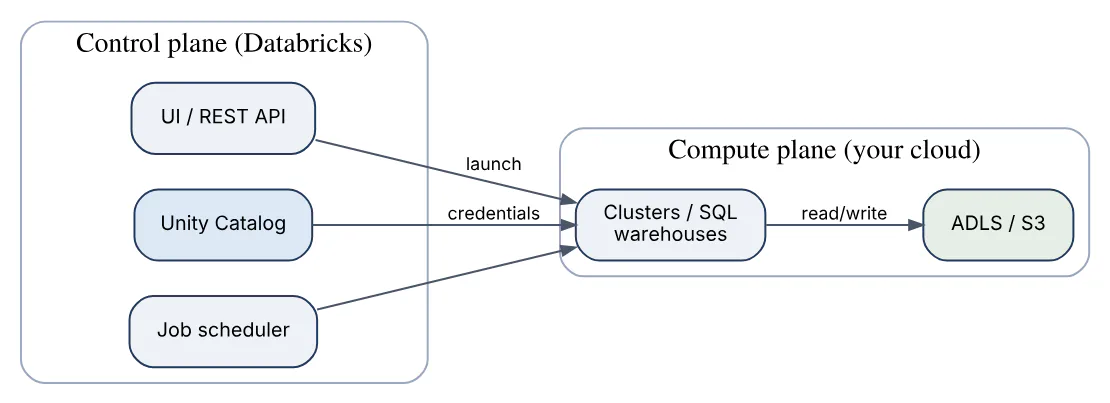
Interview takeaway: separation of planes is why Databricks can manage the platform while the customer keeps data and compute inside their own network boundary.
02In a real project using Databricks, how would you apply, test, or troubleshoot Databricks workspace architecture?
Apply. For a bank’s analytics platform I would create separate dev, test and prod workspaces in one Databricks account, all bound to the same regional Unity Catalog metastore so grants and lineage carry across environments. Each workspace gets VNet injection (Azure) or a customer-managed VPC (AWS) with private endpoints to storage, secure cluster connectivity enabled, and Private Link for the front-end so no traffic traverses the public internet. Everything—workspace settings, cluster policies, catalogs—is provisioned with Terraform using the Databricks provider rather than by hand.
Test. Before go-live I run a connectivity checklist from a cluster: dbutils.fs.ls against each external location, outbound reach to required endpoints (Maven, pip mirror), and a deny test confirming the storage account rejects traffic from outside the private endpoint. A smoke job scheduled in each environment validates that a service principal can start compute and read a Unity Catalog table.
Troubleshoot. The classic symptom is a cluster stuck in PENDING then failing with “Cluster terminated: NPIP tunnel setup failure” or DNS errors. I check the NSG/security-group rules, the user-defined route table forcing traffic through a firewall, and the Databricks-published list of required egress endpoints; subnet exhaustion is another common cause (each node consumes an IP).
An important consideration is subnet sizing: undersized subnets cap cluster scale silently, and resizing later requires recreating the workspace network.
03Explain cluster types and policies in the context of Databricks.
Databricks offers several compute types, each suited to a different workload pattern:
| Type | Lifecycle | Typical use |
|---|---|---|
| All-purpose (interactive) cluster | Started manually, shared, auto-terminates on idle | Notebook development, ad-hoc analysis |
| Job cluster | Created by a job run, destroyed at the end | Scheduled ETL; cheaper DBU rate |
| SQL warehouse | Pro/classic or serverless, auto-stop | BI dashboards, SQL analysts |
| Serverless compute | Fully managed, starts in seconds | Notebooks, jobs and pipelines without cluster admin |
Access modes matter too: Standard (formerly shared) enforces Unity Catalog isolation between users, while Dedicated (formerly single-user) assigns the cluster to one principal and supports more legacy features such as RDD APIs.
A cluster policy is a JSON document an admin attaches to users or groups. It constrains the create-cluster form: fixed values ("type": "fixed"), allow-lists, ranges or regex for attributes such as node type, max workers, auto-termination minutes, Spark version and custom tags. A user who is only entitled to a policy sees just the fields that policy leaves open.
{
  "autotermination_minutes": {"type": "range", "maxValue": 60, "defaultValue": 30},
  "node_type_id": {"type": "allowlist", "values": ["Standard_D4ds_v5"]},
  "num_workers": {"type": "range", "maxValue": 8},
  "custom_tags.cost_center": {"type": "fixed", "value": "analytics"}
}
Policies are the main lever for keeping costs and configurations consistent without removing self-service.
04In a real project using Databricks, how would you apply, test, or troubleshoot cluster types and policies?
Apply. On a retail data platform I would publish three policies: a “Personal Compute” style policy for analysts (single node, dedicated access mode, 30-minute auto-termination), a “Job ETL” policy that forces job clusters, Photon, spot/preemptible workers with on-demand driver and mandatory cost_center tags, and an “Admin” policy with no restrictions. Policies are versioned in Git and applied with Terraform so a change is reviewed before it reaches production. Schedules run on job clusters; only exploratory work happens on all-purpose clusters.
Test. For each policy I create a cluster as a member of the target group and confirm the UI hides locked fields and rejects out-of-range values through the Clusters API (POST /api/2.1/clusters/create must return INVALID_PARAMETER_VALUE). A nightly audit query over the system table system.compute.clusters lists clusters without a policy or with missing tags.
Troubleshoot. A common complaint is “the cluster I used yesterday will not start” after a policy tightening; the error names the violated attribute, and the fix is either updating the cluster definition or granting a different policy. Another is libraries failing on Standard access mode clusters because the code uses RDDs or spark.sparkContext; the remedy is rewriting to DataFrame APIs or using Dedicated access mode for that job.
A frequent mistake is to create policies without a default, so every team invents its own configuration and cost drifts within weeks.
05Explain Unity Catalog governance in the context of Databricks.
Unity Catalog is the centralised governance layer for all data and AI assets in Databricks. It replaces per-workspace Hive metastores with one account-level metastore per region and a three-level namespace: catalog.schema.table. The same model also covers views, volumes (files), functions, models and external locations.
Governance capabilities:
- Access control with standard SQL
GRANT/REVOKEon securable objects, inherited down the hierarchy; row filters and column masks apply fine-grained policies without copying data. - Storage credentials and external locations decouple cloud identity (a managed identity or IAM role) from the tables and paths users can see, so no one needs raw storage keys.
- Automatic lineage at table and column level, captured from every query run on Unity Catalog compute.
- Audit logs and system tables (
system.access.audit,system.billing.usage) record who accessed what. - Delta Sharing lets you share tables with other organisations without copying.
GRANT USE CATALOG ON CATALOG sales TO `analysts`;
GRANT SELECT ON SCHEMA sales.gold TO `analysts`;
ALTER TABLE sales.gold.customers
  SET ROW FILTER sales.security.region_filter ON (region);
This diagram shows the object hierarchy that grants are inherited through.
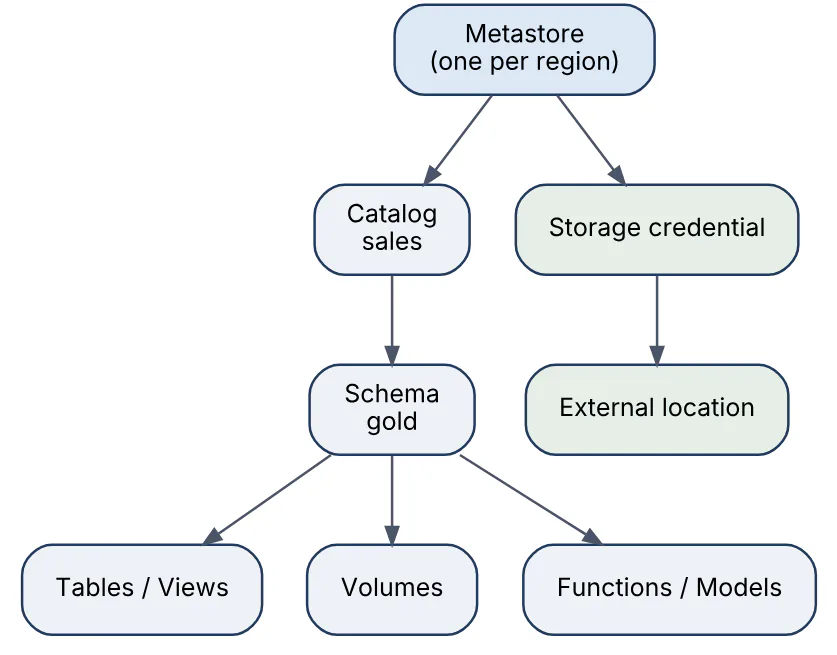
Catalogs typically map to environments or business domains; because grants are centrally stored, a permission granted once is enforced identically in every workspace attached to the metastore.
06In a real project using Databricks, how would you apply, test, or troubleshoot Unity Catalog governance?
Apply. In an insurance data platform I would create one catalog per environment and domain (claims_dev, claims_prod), own them by account-level groups synced from Entra ID or Okta via SCIM, never by individual users. Access is granted to groups at the schema level; PII columns are protected with column masks tied to a pii_readers group, and all storage access goes through external locations backed by a managed identity. Service principals own production tables so people leaving the company do not break jobs.
Test. Permission tests are automated: a job runs as a low-privilege service principal and asserts that SELECT on a masked column returns hashed values and that reading an unauthorised schema raises INSUFFICIENT_PERMISSIONS. Lineage is verified after deployment by querying system.access.table_lineage to confirm gold tables trace back to bronze sources.
Troubleshoot. The most frequent ticket is “table exists but I cannot see it”. I check in order: USE CATALOG and USE SCHEMA grants (both are required), whether the cluster is Unity Catalog-enabled with a supported access mode, and whether the workspace is bound to the catalog. Storage errors such as PERMISSION_DENIED on an external location usually mean the managed identity lacks the Storage Blob Data Contributor role, which I confirm with the “Test connection” button or LIST on the location.
A key consideration is that legacy hive_metastore tables bypass most of these controls, so migration (SYNC or deep clone) should be part of the plan.
07Explain Delta Lake ACID in the context of Databricks.
Delta Lake adds ACID transactions to Parquet files stored in a data lake. Every write to a Delta table is a transaction recorded in the _delta_log directory, which makes Databricks tables behave like database tables rather than loose collections of files.
- Atomicity – a write either commits a new log entry or leaves the table unchanged; a job that dies mid-write leaves orphan Parquet files but no partial table state.
- Consistency – schema enforcement rejects writes whose columns or types do not match, and constraints (
NOT NULL,CHECK) are validated on commit. - Isolation – readers use snapshot isolation (they see the table as of the version they started with); writers use optimistic concurrency control and get
WriteSerializableby default, which allows concurrent appends but detects conflicting updates. - Durability – once the commit file is written to cloud storage it is permanent, relying on the storage service’s durability.
The practical effect is that concurrent streaming appends, batch MERGEs and BI reads on the same table do not corrupt each other or produce half-written results, something plain Parquet directories cannot guarantee.
08In a real project using Databricks, how would you apply, test, or troubleshoot Delta Lake ACID?
Apply. For a payments ledger I would land events with a streaming append while a separate hourly job runs MERGE to apply corrections, and analysts query the same table from a SQL warehouse. ACID guarantees mean the analysts never see a partially merged hour. I would partition or cluster by transaction_date so concurrent writers touch disjoint files and avoid conflicts, and declare CHECK (amount > 0) and NOT NULL constraints so bad data is rejected atomically instead of discovered later.
Test. An integration test starts two writers against a test table: one appending, one updating overlapping rows, and asserts that DESCRIBE HISTORY shows every commit, that row counts equal the sum of inputs, and that a reader iterating during the writes sees consistent snapshots. A chaos test kills a writer mid-job and verifies the table version did not advance.
Troubleshoot. The typical failure is ConcurrentAppendException or ConcurrentDeleteReadException when two jobs modify the same partitions. I inspect DESCRIBE HISTORY to see the colliding operations and either add partition predicates to the MERGE condition so the transaction’s read set is narrower, serialise the jobs in a workflow, or switch to row-level concurrency (default on Databricks Runtime 14.2 and later for tables with deletion vectors), which resolves most of these automatically.
A common mistake is assuming ACID protects across tables: Delta transactions are single-table, so multi-table consistency needs orchestration or idempotent design.
09Explain Delta transaction log in the context of Databricks.
The transaction log is the _delta_log/ folder inside every Delta table and the source of truth for the table’s state. Each commit writes a JSON file named with a zero-padded version number (00000000000000000012.json) containing actions: add and remove for data files (with statistics such as min/max per column and row counts), metaData for schema and properties, protocol for reader/writer versions, and commitInfo describing the operation.
Reading a table means replaying these actions to compute the current set of live files. To keep that cheap, Databricks writes a Parquet checkpoint every 10 commits (00000000000000000020.checkpoint.parquet) that summarises the full state; a reader loads the latest checkpoint and only the JSON files after it. The _last_checkpoint file points to it.
This diagram shows how a reader resolves the current snapshot.

Because file statistics live in the log, Delta can skip files that cannot match a query predicate without opening them, and because old versions remain until VACUUM removes them, the log is also what powers time travel.
10In a real project using Databricks, how would you apply, test, or troubleshoot Delta transaction log?
Apply. In a clickstream platform ingesting thousands of micro-batches per day, I treat the log as an operational asset: I keep delta.logRetentionDuration at the default 30 days unless auditors need longer, avoid tiny commits by tuning trigger intervals so each micro-batch writes meaningful files, and use DESCRIBE HISTORY output in a monitoring dashboard to track operation types and numOutputRows. For external tools I expose the log through Delta’s standalone reader or UniForm rather than letting them list Parquet files directly.
Test. Pipeline tests assert on log content, not just data: after a run, DESCRIBE HISTORY must show exactly one new version with operation = 'MERGE' and the expected operationMetrics. A regression test checks that df.inputFiles() count drops after OPTIMIZE, proving the add / remove actions behave as expected.
Troubleshoot. Slow query planning on a table with millions of small files usually traces to a huge log and bloated checkpoints; OPTIMIZE plus more frequent checkpoints fixes it. A FileNotFoundException during a read means a concurrent VACUUM deleted a file still referenced by the reader’s snapshot; the fix is longer retention or spark.sql.files.ignoreMissingFiles as a temporary measure. If someone manually deleted Parquet files, the log still references them; FSCK REPAIR TABLE removes the dangling entries.
Never edit or delete files under _delta_log by hand: a missing version file makes the table unreadable from that point.
11Explain MERGE INTO upserts in the context of Databricks.
MERGE INTO is the Delta Lake statement for upserts: in one atomic transaction it matches source rows to target rows on a join condition and performs inserts, updates and deletes depending on which WHEN clause fires. It is the standard way to apply CDC feeds, deduplicate late-arriving data and maintain slowly changing dimensions on Databricks.
MERGE INTO silver.customers AS t
USING updates AS s
  ON t.customer_id = s.customer_id
WHEN MATCHED AND s.op = 'D' THEN DELETE
WHEN MATCHED AND s.updated_at > t.updated_at THEN
  UPDATE SET *
WHEN NOT MATCHED AND s.op <> 'D' THEN
  INSERT *
WHEN NOT MATCHED BY SOURCE AND t.region = 'EU' THEN DELETE;
How it works: Delta first joins source and target to find files that contain matches, then rewrites only those files (or, with deletion vectors enabled, marks deleted rows and appends new ones), and finally commits a single log entry. WHEN NOT MATCHED BY SOURCE (Databricks Runtime 12.2 and later) handles rows that vanished from the source. Schema evolution during MERGE is possible with WITH SCHEMA EVOLUTION or the autoMerge setting.
The source must not contain duplicate keys matching the same target row, otherwise the statement fails with a “multiple source rows matched” error; deduplicating the source first is a routine step.
12In a real project using Databricks, how would you apply, test, or troubleshoot MERGE INTO upserts?
Apply. In a silver layer fed by Debezium change events from an orders database, I run a streaming job with foreachBatch that deduplicates each micro-batch (keep the latest lsn per order_id with a window function) and then issues a MERGE into the silver table. The target is clustered by order_id so the match phase prunes most files, and deletion vectors are enabled so updates do not rewrite whole Parquet files. Partition or clustering columns are included in the ON clause when the key allows it.
Test. Unit tests on the deduplication function use small DataFrames with out-of-order events and assert that exactly one row per key survives with the newest timestamp. An integration test runs the merge twice on the same batch and proves idempotency: the second run reports numTargetRowsUpdated = 0 in operationMetrics. Row counts are reconciled against the source system nightly.
Troubleshoot. When a merge that used to take two minutes takes forty, I check the Spark UI for the join stage: a full scan of the target means the predicate is not pruning, often because the key column is a string with no clustering or because the ON clause wraps the column in a function. Skew on a hot key shows as one straggler task; salting or splitting the batch resolves it. The “multiple source rows matched” error always means deduplication was skipped or keyed incorrectly.
Low-shuffle merge and deletion vectors are on by default in recent runtimes, so the biggest remaining cost is usually the number of files touched, not the row count.
13Explain OPTIMIZE and ZORDER in the context of Databricks.
OPTIMIZE compacts a Delta table’s many small Parquet files into fewer, larger ones (targeting about 1 GB each by default) by rewriting them and committing the swap in one transaction. Small files are a natural by-product of streaming and frequent MERGEs, and each one costs a file-open and a log entry on every query, so compaction directly speeds up scans and planning.
ZORDER BY is an optional clause that, during the rewrite, orders rows along a space-filling curve over one or a few columns so that values of those columns are co-located in the same files. Delta records per-file min/max statistics, and with Z-ordering those ranges become narrow and non-overlapping, so a filter on a Z-ordered column skips most files.
OPTIMIZE sales.gold.transactions
WHERE event_date >= current_date() - INTERVAL 7 DAYS
ZORDER BY (customer_id, store_id);
Guidelines:
- Z-order on high-cardinality columns used in filters and joins, not on partition columns; effectiveness drops quickly beyond three or four columns.
- The operation is idempotent and incremental, but Z-ordering rewrites all matching files each run, so scope it with a
WHEREon partitions. - Predictive optimization can schedule
OPTIMIZEautomatically on Unity Catalog managed tables.
On new tables, liquid clustering has largely replaced Z-ordering because it achieves the same data skipping without full rewrites.
14In a real project using Databricks, how would you apply, test, or troubleshoot OPTIMIZE and ZORDER?
Apply. On a telemetry table receiving a streaming append every minute, I would enable delta.autoOptimize.optimizeWrite and autoCompact table properties to reduce small files at write time, then schedule a nightly job that runs OPTIMIZE ... WHERE ingest_date = yesterday ZORDER BY (device_id) because dashboards filter by device. On Unity Catalog managed tables I would turn on predictive optimization instead and let Databricks decide when compaction pays off. Z-order columns are chosen from the top filter predicates in system.query.history, not from guesswork.
Test. Before and after the first run I capture DESCRIBE DETAIL (file count, size) and the query profile of the key dashboard query, checking “files pruned” versus “files read” in the Spark UI scan node. A good result is an order-of-magnitude drop in files scanned for WHERE device_id = .... I also time the OPTIMIZE itself so the nightly window is realistic.
Troubleshoot. If OPTIMIZE seems to do nothing, operationMetrics shows numFilesRemoved = 0; the files are already near target size or the WHERE matched no partitions. If it is slow or fails on memory, the bin-packing is fine but Z-ordering too many columns or a huge unpartitioned table is the cause; narrow the scope or use spark.databricks.delta.optimize.maxFileSize to tune. Z-order benefits disappearing a day later means new writes are not ordered, which is expected and why liquid clustering is preferable for continuously written tables.
The main trade-off is write amplification: compaction rewrites data, so running it hourly on a huge table costs more than it saves.
15Explain liquid clustering in the context of Databricks.
Liquid clustering is Delta Lake’s replacement for both Hive-style partitioning and Z-ordering. Instead of fixing a directory layout at creation time, you declare clustering columns with CLUSTER BY, and Databricks incrementally organises data files so rows with similar key values land together, maintaining data-skipping statistics without rewriting the whole table.
CREATE TABLE sales.silver.orders (
  order_id BIGINT, customer_id BIGINT, order_ts TIMESTAMP, amount DECIMAL(12,2)
) CLUSTER BY (customer_id, order_ts);

ALTER TABLE sales.silver.orders CLUSTER BY (order_ts);  -- change keys later
OPTIMIZE sales.silver.orders;                            -- cluster incrementally
Why it is preferred over partitioning:
- Clustering keys can be changed at any time with
ALTER TABLE; partitions cannot. - It handles high-cardinality columns and skewed data gracefully, where partitioning creates too many small directories.
OPTIMIZEonly touches unclustered or poorly clustered files, so maintenance cost is incremental rather than a full Z-order rewrite.- Up to four clustering columns are allowed, and statistics are collected for them automatically.
CLUSTER BY AUTOlets Databricks choose and adapt keys based on observed query patterns (requires predictive optimization on Unity Catalog managed tables).
Liquid clustering is generally available on Databricks Runtime 15.2 and later and is the default recommendation for new Delta tables; row-level concurrency works well with it because writers rarely conflict on the same files.
16In a real project using Databricks, how would you apply, test, or troubleshoot liquid clustering?
Apply. Migrating a fact table that was partitioned by country and date, I would recreate it with CLUSTER BY (country, order_date) using CREATE TABLE ... AS SELECT or ALTER TABLE ... CLUSTER BY on an existing unpartitioned table, then run OPTIMIZE once to cluster historical data. Streaming writers keep appending; a scheduled OPTIMIZE (or predictive optimization) clusters new files incrementally. For a table whose access patterns are not yet clear I would start with CLUSTER BY AUTO and let the platform learn from query history.
Test. The acceptance test compares the two most common dashboard queries against the partitioned and clustered copies, recording bytes read and files scanned from the query profile; clustering should match or beat partitioning for date filters and win decisively for customer filters. I also confirm that DESCRIBE DETAIL shows clusteringColumns and that OPTIMIZE after a day of writes reports a reasonable numFilesAdded, proving incremental work.
Troubleshoot. When queries do not prune, the usual causes are that OPTIMIZE has never run since the writes (new files are unclustered until it does), or the filter column is not among the clustering keys. ALTER TABLE ... CLUSTER BY on a table with more than four keys fails outright. If an older Databricks Runtime cannot write the table, the table protocol was upgraded by enabling clustering, so all writers must be on a supporting runtime.
A notable limitation is that clustering cannot be combined with partitioning or Z-order on the same table, so the migration is a decision, not an addition.
17Explain VACUUM retention in the context of Databricks.
VACUUM deletes data files that are no longer referenced by the current version of a Delta table and are older than a retention threshold. Files become unreferenced when UPDATE, DELETE, MERGE or OPTIMIZE rewrite them; until vacuumed they still consume storage and still support time travel.
The retention threshold defaults to 7 days (delta.deletedFileRetentionDuration = interval 7 days). VACUUM table RETAIN 168 HOURS is therefore the default behaviour, and attempting a shorter interval fails with a safety check unless spark.databricks.delta.retentionDurationCheck.enabled is set to false.
VACUUM sales.silver.orders DRY RUN;             -- list files that would go
VACUUM sales.silver.orders;                     -- default 7-day retention
VACUUM sales.silver.orders RETAIN 240 HOURS;    -- keep 10 days of history
Key consequences:
- Time travel and
RESTOREonly work back to the oldest version whose files have not been vacuumed; the log retention (delta.logRetentionDuration, 30 days) is separate and governs how long version metadata survives. - Long-running jobs or streaming readers that started before a
VACUUMcan fail if their snapshot’s files are removed, which is the reason for the 7-day guard. VACUUMis itself a transaction logged in history (VACUUM START/VACUUM ENDentries) and on Unity Catalog managed tables predictive optimization can run it automatically.
Lowering retention trades recoverability for storage cost; most teams keep at least 7 days.
18In a real project using Databricks, how would you apply, test, or troubleshoot VACUUM retention?
Apply. For a silver layer of frequently merged tables I would run VACUUM weekly from a maintenance job, keep the default 7-day retention for operational tables, and raise it to 30 days on finance tables where auditors may need to restore month-end snapshots. On Unity Catalog managed tables I would delegate this to predictive optimization. Retention is set as a table property so every maintenance run and every engineer honours the same value, and the policy is documented alongside the storage budget.
Test. VACUUM ... DRY RUN is run first in each environment and the file list is compared against expectations (no files newer than the threshold). After a real run I check DESCRIBE HISTORY for the VACUUM END entry and numDeletedFiles, then confirm SELECT ... VERSION AS OF still works for versions inside the retention window and fails cleanly for versions outside it. Storage metrics from the cloud provider should show the expected drop.
Troubleshoot. A streaming job failing with FileNotFoundException after a maintenance window points to a VACUUM with retention shorter than the job’s checkpoint lag; the fix is restoring from a backup if available, otherwise restarting the stream with a fresh checkpoint and extending retention. If storage keeps growing despite vacuuming, I check whether OPTIMIZE is producing new versions faster than files are deleted, or whether old data sits outside the table path entirely (orphaned from a failed write), which VACUUM also handles after the retention period.
Disabling the retention safety check in a shared notebook is a classic mistake: a single RETAIN 0 HOURS can break every concurrent reader of that table.
19Explain medallion bronze silver gold in the context of Databricks.
The medallion architecture is a layered design pattern for lakehouse tables in which data quality improves as it moves through bronze, silver and gold layers, each implemented as Delta tables, usually in separate Unity Catalog schemas or catalogs.
- Bronze holds raw data exactly as ingested (append-only, with source metadata such as file name and ingest timestamp). It is the replayable system of record for the lake.
- Silver holds cleaned, deduplicated, conformed data: types enforced, keys resolved, CDC applied with
MERGE, enterprise-wide definitions applied once. - Gold holds business-level aggregates and dimensional models ready for BI, ML features and APIs, often denormalised and tuned for query performance.
This diagram shows the flow and the typical tooling at each hop.

The pattern separates concerns: ingestion failures are isolated in bronze, business rule changes are re-run from bronze without re-reading sources, and consumers only touch gold. It is a guideline, not a rule; some pipelines add a landing zone before bronze or skip gold for data science.
20In a real project using Databricks, how would you apply, test, or troubleshoot medallion bronze silver gold?
Apply. For a logistics company I would implement the layers as three Unity Catalog schemas per domain (shipments.bronze, shipments.silver, shipments.gold). Bronze is written by Auto Loader streams with _metadata.file_path and ingest_ts columns and mergeSchema enabled, so source changes never break ingestion. Silver uses Lakeflow pipelines with expectations for nulls and referential integrity and APPLY CHANGES for CDC. Gold tables are materialized views refreshed on a schedule and clustered by the dimensions dashboards filter on. Grants differ by layer: engineers read bronze, analysts read only gold.
Test. Each layer has reconciliation checks: bronze row counts match source file counts per day, silver primary keys are unique (a failing expectation drops the pipeline update), and gold totals equal the silver sums they derive from. These run as a validation task after the pipeline in the same job and fail the run on mismatch. Sample-based “golden record” tests follow a few known shipments through all three layers.
Troubleshoot. When gold numbers disagree with the source system, I walk backwards: compare gold to silver, then silver to bronze for the affected keys, using DESCRIBE HISTORY to see which run introduced the change and time travel to diff versions. Most discrepancies trace to late-arriving CDC events applied out of order in silver or to a filter in gold that excluded a new status code.
A common mistake is letting business logic leak into bronze, which destroys its value as a replayable raw copy.
21Explain Auto Loader in the context of Databricks.
Auto Loader is the Databricks Structured Streaming source (cloudFiles format) that incrementally ingests new files from cloud object storage as they arrive. It tracks which files have been processed in a RocksDB-backed state in the checkpoint location, so each file is loaded exactly once even across restarts, without the user listing directories or maintaining a processed-files table.
(spark.readStream.format("cloudFiles")
  .option("cloudFiles.format", "json")
  .option("cloudFiles.schemaLocation", "/checkpoints/orders/schema")
  .option("cloudFiles.inferColumnTypes", "true")
  .load("abfss://landing@acct.dfs.core.windows.net/orders/")
  .writeStream
  .option("checkpointLocation", "/checkpoints/orders/bronze")
  .trigger(availableNow=True)
  .toTable("shipments.bronze.orders"))
Key features:
- File discovery modes: directory listing (default, with incremental listing for lexically ordered paths) or file notification mode using storage events and a queue, which scales to millions of files.
- Schema inference and evolution: the schema is stored at
schemaLocation; new columns can trigger a controlled stream restart (addNewColumnsdefault) and unparseable data goes to a_rescued_datacolumn. - Supports JSON, CSV, Parquet, Avro, ORC, text and binary files.
trigger(availableNow=True)lets the same code run as a scheduled batch job, processing everything new and stopping.
Auto Loader is the standard bronze-layer ingestion tool and is what Lakeflow pipelines use when you call read_files or cloud_files on a streaming table.
22In a real project using Databricks, how would you apply, test, or troubleshoot Auto Loader?
Apply. For a supplier EDI feed dropping tens of thousands of small CSV files per day into ADLS, I would use file notification mode (cloudFiles.useNotifications = true) so Databricks provisions an Event Grid subscription and queue instead of listing the container, set cloudFiles.schemaHints for columns whose inferred type is wrong, keep _rescued_data and route non-null rescued rows to a quarantine table, and run with availableNow every 15 minutes from a job. Each source gets its own checkpoint and schema location; those paths are never shared between streams.
Test. In a test container I drop a known set of files including a malformed one and a file with a new column, then assert: row count equals the valid rows, the malformed row lands in _rescued_data, and the stream fails once with UnknownFieldException and succeeds on restart with the new column present. cloud_files_state('/checkpoints/orders/bronze') is queried to confirm every file was registered exactly once.
Troubleshoot. “Files are in storage but never ingested” usually means the files were written before the stream’s first run with includeExistingFiles = false, the glob pattern misses a subfolder, or notification mode lost events (queue permissions). Reprocessing a single file is done with cloudFiles.backfillInterval for periodic listing or by copying the file under a new name. Slow listing on huge directories is fixed by switching to notification mode or structuring paths lexically by date.
Deleting a checkpoint to “reset” reingests every file, so backfills should use a separate stream writing to a staging table.
23Explain structured streaming checkpoints in the context of Databricks.
A checkpoint is the durable state that lets a Structured Streaming query resume exactly where it stopped. Every query must have a checkpointLocation on reliable storage (cloud object storage or a Unity Catalog volume); Databricks writes to it at each micro-batch.
What it contains:
- offsets/ – for each batch, the source offsets committed to process (Kafka offsets, Auto Loader file batches, Delta table version).
- commits/ – a marker written after the batch’s sink write succeeded; a batch with an offset but no commit is re-executed on restart, which is why sinks must be idempotent (Delta sinks are, via the batch id).
- state/ – RocksDB or HDFS-backed state for stateful operators (aggregations,
dropDuplicates, stream-stream joins,mapGroupsWithState), stored per partition per batch. - metadata – the query id and the sources’ schemas.
This diagram shows the order of writes within one micro-batch.

Rules that follow from this design: one checkpoint belongs to one query writing to one sink; changing the source, the number or type of stateful operators, or the output schema in incompatible ways invalidates the checkpoint and requires a new location (and typically a reprocessing plan). Stateful operators need the RocksDB state store (spark.sql.streaming.stateStore.providerClass) for large state, and watermarks bound how much state is retained.
Checkpoints are what turn Structured Streaming’s “at-least-once” source replay into end-to-end exactly-once semantics on Delta tables.
24In a real project using Databricks, how would you apply, test, or troubleshoot structured streaming checkpoints?
Apply. For a Kafka-to-Delta pipeline computing hourly session counts, I would put each query’s checkpoint under a dedicated Unity Catalog volume path named after the target table and version (/Volumes/ops/checkpoints/sessions_v2), use the RocksDB state store with changelog checkpointing to keep commit latency low, set a watermark of 2 hours so state is bounded, and define the trigger as processingTime="1 minute" or availableNow depending on whether the job runs continuously. The job has max_retries and a single concurrent run so two instances never share a checkpoint.
Test. The failover test kills the job mid-batch and restarts it, then asserts no duplicate rows in the target (Delta’s idempotent sink by batch id) and no gaps in Kafka offsets by comparing the offsets/ files with the source’s end offsets. A schema-change test adds a column to the source and verifies the stream either continues (additive) or fails fast with a clear message rather than silently dropping data. Streaming metrics (numInputRows, batchDuration, state store memory) are pushed to the monitoring system through a StreamingQueryListener.
Troubleshoot. A stream that restarts and immediately dies with “offsets out of range” means Kafka retention expired past the checkpointed offset; the fix is a new checkpoint with startingOffsets set deliberately and a backfill. Ever-growing batch duration and executor memory indicate unbounded state (missing watermark or a dropDuplicates without one); state store metrics in the Spark UI “Structured Streaming” tab confirm it.
Never reuse a checkpoint after changing the query’s stateful logic; the resulting errors are confusing and the state is already corrupt.
25Explain Delta Live Tables Lakeflow in the context of Databricks.
Delta Live Tables (DLT) is the former name of Lakeflow Spark Declarative Pipelines, usually shortened to Lakeflow pipelines; Databricks renamed the product in 2025 and the core API was donated to Apache Spark as Spark Declarative Pipelines. The concept is unchanged: you declare the tables a pipeline should produce as SQL or Python definitions, and the framework works out dependencies, provisions compute, orchestrates execution, applies data quality expectations and handles retries and incremental processing.
Two table types exist. Streaming tables process each input record exactly once and suit append-only ingestion and CDC (AUTO CDC / APPLY CHANGES INTO). Materialized views are recomputed from their inputs, incrementally where the engine can prove it is safe.
from pyspark import pipelines as dp
from pyspark.sql.functions import col

@dp.table(comment="Raw orders from landing zone")
def bronze_orders():
    return (spark.readStream.format("cloudFiles")
            .option("cloudFiles.format", "json")
            .load("/Volumes/sales/landing/orders"))

@dp.materialized_view()
@dp.expect_or_drop("valid_amount", "amount > 0")
def silver_orders():
    return spark.read.table("bronze_orders").filter(col("status").isNotNull())
The older import dlt module, @dlt.table and the LIVE. prefix still work, but new code uses pyspark.pipelines. Pipelines run in triggered or continuous mode, on serverless or classic compute, and publish tables to Unity Catalog; the event log records lineage, expectation metrics and run history. The main trade-off versus hand-written jobs is less control over execution details in exchange for far less orchestration code.
26In a real project using Databricks, how would you apply, test, or troubleshoot Delta Live Tables Lakeflow?
Apply. For a subscription-billing domain I would build one pipeline per domain with bronze streaming tables fed by Auto Loader, silver tables maintained with AUTO CDC INTO from Debezium events (SCD type 1 for current state, type 2 for history), and gold materialized views. The pipeline runs on serverless compute, triggered hourly from a Lakeflow Job, with development mode in the dev target so clusters stay warm, and the whole thing is deployed through a Databricks Asset Bundle so dev and prod differ only in catalog and schema parameters.
Test. Transformations are written as plain functions that take and return DataFrames, so pytest can exercise them locally with Databricks Connect before they are wrapped in @dp.table. In CI the bundle deploys to an ephemeral schema, runs a full refresh on fixture data, and a test queries the event log (event_log(TABLE(...))) to assert zero expect_or_fail violations and expected row counts. A dry run validates the graph without processing data.
Troubleshoot. When an update fails, the pipeline UI pins the failing flow and the event log holds the stack trace; the usual culprits are a materialized view reading a streaming table with a non-append operation (needs skipChangeCommits), a schema change in CDC source, or expectation failures. Slow updates are diagnosed by checking which flows did full recomputation instead of incremental; the flow_progress events say so.
A common mistake is triggering FULL REFRESH on a streaming table fed from a source with limited retention, which permanently loses data.
27Explain Databricks Jobs workflows in the context of Databricks.
Databricks Jobs (now branded Lakeflow Jobs, previously Workflows) is the native orchestrator for running work on the platform. A job is a directed acyclic graph of tasks; each task can be a notebook, Python script or wheel, SQL query or file, Lakeflow pipeline update, dbt project, JAR, or another job. Tasks declare dependencies, can run conditionally (run_if on upstream results, If/else condition tasks) and can iterate with For each tasks.
Core capabilities:
- Triggers: cron schedules, file-arrival triggers on a storage path, table-update triggers, continuous mode, or REST/CLI runs.
- Compute: each task picks a job cluster (shared across tasks in a run), serverless compute, or an existing all-purpose cluster.
- Parameters at job and task level, with dynamic values such as
{{job.run_id}}and task values passed between tasks viadbutils.jobs.taskValues. - Reliability: retries per task, timeouts, maximum concurrent runs, queueing, and notifications or webhooks on start, success, failure or duration thresholds.
- Repair run re-executes only failed tasks and their dependents.
This diagram shows a typical multi-task job.

Jobs are defined declaratively in YAML within Databricks Asset Bundles, which is the recommended way to version and promote them between workspaces.
28In a real project using Databricks, how would you apply, test, or troubleshoot Databricks Jobs workflows?
Apply. For a daily finance close process I would define a single job in a Databricks Asset Bundle: an ingestion task on a job cluster, a Lakeflow pipeline task, a SQL validation task on a serverless warehouse, and a conditional task that publishes gold tables only when validation passes. The job runs as a service principal, uses a queue with max_concurrent_runs = 1 so a late previous run cannot overlap, has per-task retries with exponential delay, and sends failure alerts to a PagerDuty webhook plus a Slack channel. Parameters like run_date default to {{job.start_time.iso_date}} so reruns for a past day are a one-line change.
Test. The bundle is validated (databricks bundle validate) and deployed to a dev target in CI, where a databricks bundle run executes it against a small fixture dataset and the pipeline asserts exit status. Notebook tasks exit with dbutils.notebook.exit(json) so downstream tests inspect structured results. I also test the failure path by injecting a bad file and confirming the alert fires and the publish task is skipped.
Troubleshoot. A run that sits in PENDING for 20 minutes is usually cluster capacity (cloud quota or spot unavailability), visible in the run’s event log; the fix is a fallback instance pool or serverless. Tasks failing only in prod typically point at permissions of the service principal on tables or secrets. For flaky upstream dependencies I use repair run rather than rerunning the entire DAG.
Avoid chaining jobs through notebooks calling dbutils.notebook.run; task dependencies give visibility and repair that nested notebooks lack.
29Explain Databricks SQL warehouses in the context of Databricks.
A SQL warehouse is the compute resource behind Databricks SQL: the SQL editor, dashboards, alerts, and JDBC/ODBC connections from tools such as Power BI and Tableau. It presents an endpoint that accepts ANSI SQL, runs it with Photon, and returns results with cloud-storage-backed result caching, while the data stays in Delta tables governed by Unity Catalog.
Three types exist:
| Type | Where it runs | Characteristics |
|---|---|---|
| Serverless | Databricks-managed compute | Starts in seconds, Intelligent Workload Management, lowest idle cost |
| Pro | Your cloud account | Full feature set, minutes to start, needs capacity planning |
| Classic | Your cloud account | Entry-level, fewer features, legacy option |
Sizing is expressed in T-shirt sizes (2X-Small to 4X-Large); a size defines the per-cluster capacity, and scaling (min/max clusters) adds parallel clusters when queries queue. Auto-stop shuts the warehouse after a configurable idle period. Query history, the query profile, and system.query.history give visibility into every statement.
Compared with running SQL on an all-purpose cluster, warehouses are tuned for short, concurrent BI queries, offer result caching across users, and bill at a SQL-specific DBU rate, which is why they are the standard choice for analysts and BI tools.
30In a real project using Databricks, how would you apply, test, or troubleshoot Databricks SQL warehouses?
Apply. Serving a Power BI estate for a retail chain, I would provision a serverless warehouse per audience: a Medium with scaling 1–4 for shared dashboards, a Small with auto-stop at 10 minutes for analysts’ ad-hoc work, and a dedicated warehouse for the scheduled import refreshes so they cannot starve interactive users. Power BI connects with a service principal via OAuth, dashboards query gold tables clustered on the filter columns, and Unity Catalog grants rather than warehouse access decide who sees what.
Test. Load testing uses a script that replays the top 50 queries from system.query.history with 30 concurrent sessions through the SQL Statement Execution API, measuring p95 latency and queue time against a target (under 5 seconds for dashboard tiles). Result cache behaviour is verified by running the same query twice and confirming the second shows as a cache hit in the query profile. Auto-stop and scale-down are observed in billing system tables after a quiet weekend.
Troubleshoot. When a dashboard is slow, the query profile is the first stop: large “files read” with little pruning means missing clustering or statistics; long “queued” time means scaling max is too low; heavy spill indicates a size too small for the join. A BI tool generating thousands of tiny metadata queries can be throttled by caching the model (import mode) instead of DirectQuery. Connection failures from on-premises gateways are almost always firewall or Private Link misconfiguration, verified with the warehouse’s connection details and a curl to the endpoint.
The important consideration is that bigger is not always faster: a 2X-Large warehouse running single-threaded queries wastes money, while more clusters (scaling) is what fixes concurrency.
31Explain Photon execution engine in the context of Databricks.
Photon is Databricks’ native vectorised query engine, written in C++, that replaces parts of Spark’s JVM-based execution while keeping the Spark APIs, planner and DataFrame semantics unchanged. When Photon is enabled on a cluster or SQL warehouse, the Catalyst optimiser produces the plan as usual and, operator by operator, hands execution to Photon wherever the operator and data types are supported; unsupported pieces fall back to the regular Spark engine within the same query.
How it achieves speed:
- Columnar, vectorised processing of batches of rows using SIMD instructions instead of row-at-a-time JVM code generation.
- Operates directly on Parquet/Delta columnar data without Java object overhead, with adaptive memory management and no garbage-collection pauses.
- Accelerates scans, filters, projections, hash joins, aggregations, sorts, window functions, and Delta
MERGE/UPDATEpaths.
This diagram shows where Photon sits in query execution.

Photon is always on for SQL warehouses and serverless compute and is a checkbox (“Use Photon Acceleration”) on classic clusters, where it carries a higher DBU rate justified by shorter runtimes. In the Spark UI, Photon operators appear with a Photon prefix in the physical plan, and the query profile indicates the share of time spent in Photon.
Workloads that benefit least are those dominated by Python UDFs, RDD code, or non-Delta sources, because those still execute in the JVM or in Python workers.
32In a real project using Databricks, how would you apply, test, or troubleshoot Photon execution engine?
Apply. On a nightly ETL that joins a 2 TB clickstream fact with dimension tables and writes gold aggregates, I would enable Photon on the job cluster and rewrite the few Python UDFs as native Spark SQL expressions or pandas UDFs so the plan stays inside Photon end to end. SQL warehouses already use it, so the rule is simply to express transformations in DataFrame/SQL operations and keep data in Delta so the vectorised reader applies.
Test. The comparison is empirical: run the job on the same data with Photon on and off, recording wall time and DBUs from system.billing.usage; Photon is a win when cost per run drops, not merely when time drops, because of its higher DBU multiplier. In the query profile I check what fraction of operators are Photon and look for a “Photon fallback” note in the plan explaining what was not supported. Correctness is confirmed by checksumming outputs from both runs.
Troubleshoot. If a job shows no improvement, EXPLAIN typically reveals ColumnarToRow transitions around a Python UDF, a collect_list on complex nested types, or an RDD conversion, each forcing a fallback. Memory errors unique to Photon runs can stem from very wide rows or huge string columns; raising executor memory or reducing partition size helps. Photon also requires a compatible instance type (AVX2 support), which the cluster UI enforces.
The practical rule is to measure cost per run rather than assume Photon always pays off, especially for small or UDF-heavy jobs.
33Explain Spark adaptive query execution in the context of Databricks.
Adaptive Query Execution (AQE) lets Spark re-optimise a query plan at runtime using statistics collected at shuffle boundaries, rather than relying solely on estimates made before execution. It has been enabled by default on Databricks since Databricks Runtime 7.3 (spark.sql.adaptive.enabled = true).
Three main optimisations happen after each shuffle stage completes:
- Coalescing shuffle partitions: the default 200 partitions become fewer, larger partitions based on actual data size, eliminating tiny tasks.
- Dynamic join strategy switching: if a side of a join turns out to be small enough (below
spark.sql.autoBroadcastJoinThreshold, default 10 MB on Spark; Databricks uses 30 MB), a planned sort-merge join becomes a broadcast hash join, removing a shuffle. - Skew join handling: partitions far larger than the median (
skewedPartitionFactor5,skewedPartitionThresholdInBytes256 MB by default) are split into multiple tasks so one straggler does not hold up the stage.
Databricks additionally uses AQE to dynamically detect and propagate empty relations and to pick better plans for Delta MERGE. In the Spark UI the final plan is marked AdaptiveSparkPlan with isFinalPlan=true, and the original and final plans can be compared.
AQE reduces the need to hand-tune spark.sql.shuffle.partitions and salting, although it cannot fix skew in map-side operations or in non-shuffle joins.
34In a real project using Databricks, how would you apply, test, or troubleshoot Spark adaptive query execution?
Apply. In a customer-360 pipeline with a heavily skewed join on customer_id (a handful of corporate accounts own millions of events), I would rely on AQE rather than salting: keep spark.sql.adaptive.enabled on, set spark.sql.adaptive.coalescePartitions.initialPartitionNum higher than the default for very large inputs so coalescing has room to work, and leave spark.sql.shuffle.partitions on auto (Databricks setting) so AQE decides partition counts. For dimension joins I confirm statistics are present with ANALYZE TABLE ... COMPUTE STATISTICS so the initial plan is already reasonable.
Test. Performance tests capture the final plan via df.explain("formatted") or the Spark UI and assert the join type changed from SortMergeJoin to BroadcastHashJoin where expected and that a skew=true annotation appears on the skewed join side. Task duration histograms in the stage detail should flatten; before AQE the max task might be 20 minutes against a 30-second median. Runtime and shuffle write bytes are recorded per release so regressions are caught.
Troubleshoot. A query still showing one long task despite AQE usually means the skew is in a non-shuffle operation (an exploded array or a window over the hot key) or the skewed partition is still below the threshold; lowering skewedPartitionThresholdInBytes or salting that specific key resolves it. Out-of-memory on the driver after an unexpected broadcast means AQE promoted a join whose side was estimated small but compressed heavily; lowering autoBroadcastJoinThreshold or hinting MERGE fixes that.
Hints such as /*+ BROADCAST */ override AQE, so stale hints in old code can block the better plan.
35Explain job cluster cost controls in the context of Databricks.
Job cluster cost is driven by three multipliers: cloud VM hours, DBUs per hour (which depend on compute type, Photon and tier), and how long the cluster lives. Controls act on each.
- Use job clusters or serverless, not all-purpose clusters: job compute bills at a much lower DBU rate than interactive compute and terminates when the run ends; serverless removes start-up time and idle cost entirely.
- Right-size and autoscale: set a small minimum worker count with autoscaling, or use fixed sizes for predictable jobs where autoscale churn wastes time. Enhanced autoscaling in Lakeflow pipelines scales down aggressively.
- Spot/preemptible instances for workers with an on-demand driver, and instance pools to cut start-up time and reuse warm VMs across tasks.
- Cluster policies that fix Photon, instance families, max workers and mandatory tags so cost can be attributed by team or project.
- Share one job cluster across tasks in a multi-task job instead of one cluster per task.
- Timeouts and retries so a hung job does not run for hours;
max_concurrent_runsso backlogs do not fan out. - Observability through
system.billing.usagejoined tosystem.billing.list_prices, with budgets and budget policies on serverless usage.
Choosing the right Databricks Runtime also matters: newer runtimes with Photon often finish faster and cheaper even at a higher per-hour rate.
36In a real project using Databricks, how would you apply, test, or troubleshoot job cluster cost controls?
Apply. Taking over a data platform whose bill doubled in a quarter, I would first build a cost dashboard from system.billing.usage grouped by usage_metadata.job_id and the cost_center tag, then apply policies: all scheduled work moves to job clusters or serverless, every job cluster policy enforces spot workers with on-demand driver, Photon, autoscaling 2–8, and a 2-hour timeout. Small hourly jobs are consolidated into one multi-task job sharing a cluster. Development notebooks keep a 30-minute auto-termination and run on serverless so idle all-purpose clusters disappear.
Test. Each change is measured against a baseline week: DBUs and cloud cost per job run from the billing tables, plus run duration from system.lakeflow.job_run_timeline. I run the heaviest job with fixed versus autoscaled workers to see whether autoscale actually saves money or just adds scale-up delay. Budget alerts in the account console are tested by setting a deliberately low threshold.
Troubleshoot. A job whose cost spikes without code changes usually has data growth, a lost spot capacity causing on-demand fallback, or a retry loop; the run timeline and cluster event log show which. Clusters that stay alive after the job are all-purpose clusters referenced by existing_cluster_id, not job clusters. Autoscaling that never scales down points to a streaming task holding the cluster, which belongs on its own compute.
The trade-off to state clearly is that spot instances can be reclaimed mid-run, so critical SLAs may justify on-demand workers at a higher price.
37Explain secrets and service principals in the context of Databricks.
Secrets in Databricks are stored in secret scopes, either Databricks-backed (encrypted in the control plane) or, on Azure, backed by Azure Key Vault. Code reads them with dbutils.secrets.get(scope, key) or via {{secrets/scope/key}} references in Spark configuration and environment variables; values are redacted in notebook output and never written to logs. Access to a scope is granted with ACLs (READ, WRITE, MANAGE) through the Secrets API or CLI.
jdbc_pwd = dbutils.secrets.get(scope="erp", key="jdbc-password")
df = (spark.read.format("jdbc")
      .option("url", "jdbc:sqlserver://erp.internal:1433;database=sales")
      .option("dbtable", "dbo.orders")
      .option("user", "etl_reader")
      .option("password", jdbc_pwd)
      .load())
A service principal is a non-human identity for automation. In Unity Catalog it can own catalogs and tables, hold grants and run jobs as run_as, so production pipelines do not depend on a person’s account. Authentication is via OAuth machine-to-machine (client id and secret issued by Databricks), or on Azure via an Entra ID application; personal access tokens for service principals are possible but OAuth is the recommended path. Service principals are created at the account level and assigned to workspaces and groups, and the audit log attributes their actions distinctly.
Together they form the standard pattern: jobs run as a service principal, which reads credentials from a secret scope, while humans hold neither the identity nor the raw secrets.
38In a real project using Databricks, how would you apply, test, or troubleshoot secrets and service principals?
Apply. For a pipeline pulling from an on-premises SQL Server and a SaaS API, I would create one service principal per environment (sp-sales-prod), make it owner of the production catalog and run_as for every job, and grant it READ on a Key Vault-backed secret scope holding the JDBC password and API key. Terraform creates the principal, scope and ACLs; CI/CD authenticates with the principal’s OAuth client credentials (DATABRICKS_CLIENT_ID / DATABRICKS_CLIENT_SECRET) rather than any personal token. Secret rotation happens in Key Vault; code is unaffected because it only references the key name.
Test. A smoke job running as the service principal asserts it can fetch each secret and connect to each source, and a negative test running as an analyst group member asserts dbutils.secrets.get fails with a permission error. Audit log queries on system.access.audit confirm getSecret events are attributed to the principal. Rotation is rehearsed in dev: rotate the Key Vault secret, rerun the job, confirm success without redeploying.
Troubleshoot. Secret does not exist with scope after a Key Vault rotation generally means the scope points at the wrong vault or the Databricks service lacks Get / List on the vault’s access policy or RBAC role. Jobs failing with PERMISSION_DENIED on a table that works for a human indicate the grant was given to the person, not the principal. An OAuth token error in CI usually comes from a secret that expired; service principal OAuth secrets have a maximum lifetime and must be rotated.
The main mistake is printing or display -ing a secret while debugging: redaction only masks exact matches, and a transformed value leaks.
39Explain data quality expectations in the context of Databricks.
Expectations are declarative data quality rules attached to tables in Lakeflow pipelines (formerly Delta Live Tables). Each expectation is a name plus a boolean SQL expression evaluated for every row written to the table, together with an action taken when the expression is false:
| Decorator / clause | On violation | Use when |
|---|---|---|
expect / EXPECT | Keep the row, record the metric | Monitoring and dashboards |
expect_or_drop / ON VIOLATION DROP ROW | Discard the row, record the metric | Bad rows can be excluded safely |
expect_or_fail / ON VIOLATION FAIL UPDATE | Fail the pipeline update, roll back the table | Violations mean the batch is untrustworthy |
CREATE OR REFRESH STREAMING TABLE silver_orders (
  CONSTRAINT valid_id     EXPECT (order_id IS NOT NULL) ON VIOLATION DROP ROW,
  CONSTRAINT valid_amount EXPECT (amount > 0),
  CONSTRAINT known_status EXPECT (status IN ('NEW','PAID','CANCELLED'))
    ON VIOLATION FAIL UPDATE
)
AS SELECT * FROM STREAM bronze_orders;
Pass and fail counts for every expectation are written to the pipeline event log and shown in the UI, so quality trends can be queried and alerted on. expect_all, expect_all_or_drop and expect_all_or_fail take a dictionary of rules, which is how teams share portable rule sets across tables.
Outside pipelines, the related tools are Delta table constraints (NOT NULL, CHECK), which reject the whole write, and Lakehouse Monitoring, which profiles tables statistically over time rather than row by row.
40In a real project using Databricks, how would you apply, test, or troubleshoot data quality expectations?
Apply. In a healthcare claims pipeline I would layer expectations by severity: bronze keeps everything, silver applies expect_or_drop on structural rules (non-null patient id, parseable dates) and expect on business plausibility (claim amount under a cap) so anomalies are measured but not hidden, and gold uses expect_or_fail on referential rules (every claim’s provider exists in the dimension) because publishing broken aggregates is worse than a delayed refresh. Dropped rows are not lost: a parallel quarantine table selects the same source with the negated predicate so stewards can review them.
Test. Rule sets live in a shared Python dictionary that pytest validates against fixture rows with known good and bad values before deployment. After each pipeline run a job queries the event log, pivots flow_progress.data_quality.expectations into pass/fail counts per rule, and fails the job if a drop rate exceeds a threshold (for example 1 percent), which catches gradual degradation that expect alone would silently tolerate.
Troubleshoot. A sudden spike in a drop rule typically reflects an upstream schema or format change (dates arriving as dd/MM/yyyy), found by sampling the quarantine table. A pipeline failing on expect_or_fail requires fixing the source or, if the rule itself is wrong, redeploying the pipeline; the table automatically rolled back so no partial data was published. Expectations that never show failures may be evaluating NULL to NULL and passing; rules should be written as col IS NOT NULL AND col > 0.
A frequent mistake is placing every rule as expect_or_fail, which turns small data issues into nightly outages.
41Explain schema evolution in the context of Databricks.
Schema evolution is Delta Lake’s controlled way of letting a table’s schema change as incoming data changes, in contrast to schema enforcement, which is the default behaviour of rejecting any write whose columns or types do not match the table.
Mechanisms:
.option("mergeSchema", "true")on a write (orspark.databricks.delta.schema.autoMerge.enabledfor a session) adds new columns and new nested struct fields; it also widens some types such asNullTypeto a concrete type. It never drops columns or changes incompatible types.MERGE INTO ... WITH SCHEMA EVOLUTION(Databricks Runtime 15.2 and later) applies the same rule to upserts..option("overwriteSchema", "true")withmode("overwrite")replaces the schema entirely, which is a different operation and rewrites the data.- Explicit DDL:
ALTER TABLE ... ADD COLUMNS,RENAME COLUMNandDROP COLUMN(the latter two require column mapping modename), and type widening (delta.enableTypeWidening) for safe promotions such asINTtoBIGINT. - In Auto Loader and Lakeflow pipelines,
cloudFiles.schemaEvolutionMode(addNewColumns,rescue,failOnNewColumns,none) decides whether new source columns stop the stream, land in_rescued_data, or are ignored.
(df.write.format("delta")
   .mode("append")
   .option("mergeSchema", "true")
   .saveAsTable("shipments.bronze.events"))
Streaming readers of a Delta table see the new column automatically, but downstream tables and views with explicit column lists must be updated by hand; the evolution stops at the first table that enumerates columns.
42In a real project using Databricks, how would you apply, test, or troubleshoot schema evolution?
Apply. For an IoT platform where firmware releases add telemetry fields every few weeks, I would allow evolution only at the edges: Auto Loader in addNewColumns mode writes into bronze with mergeSchema, so new fields appear without an engineer, and _rescued_data captures type mismatches. Silver tables use explicit SELECT lists and MERGE ... WITH SCHEMA EVOLUTION only for fields approved through a schema registry change; gold never evolves automatically because BI models depend on it. Column mapping is enabled on silver so renames can be done without rewriting history.
Test. A contract test in CI reads the current bronze schema and the documented schema and fails on unexpected removals or type changes; additions are allowed but logged. An integration test feeds a batch with one new column and one type conflict, asserting the new column exists in bronze, the conflicting value is in _rescued_data, and the silver pipeline still runs. Downstream, DESCRIBE TABLE snapshots are diffed between runs.
Troubleshoot. AnalysisException: A schema mismatch detected when writing to the Delta table means enforcement blocked a write; the message lists the offending columns, and the choice is to enable mergeSchema for a legitimate addition or fix the producer. A silver pipeline that silently loses data after a source rename is the classic trap: the old column fills with nulls, the new one is ignored because of an explicit select, and only a null-rate expectation catches it. Type changes such as INT to STRING cannot merge and require a new column or a controlled rewrite.
Unbounded evolution in bronze is fine; unbounded evolution in gold is how dashboards break on Monday morning.
43Explain time travel and rollback in the context of Databricks.
Time travel is the ability to query a Delta table as it existed at an earlier version or timestamp, made possible because the transaction log keeps every version’s file list and VACUUM has not yet removed the files. Rollback uses the same mechanism to make an earlier version the current one.
SELECT * FROM sales.silver.orders VERSION AS OF 42;
SELECT * FROM sales.silver.orders TIMESTAMP AS OF '2026-10-31 23:00:00';

DESCRIBE HISTORY sales.silver.orders;          -- find the version to return to
RESTORE TABLE sales.silver.orders TO VERSION AS OF 41;
Behaviour to know:
RESTOREis itself a new commit: it re-adds the old files and removes the current ones, so history is preserved and the restore can be undone.- Readable history is bounded by both
delta.logRetentionDuration(30 days default) anddelta.deletedFileRetentionDuration(7 days default); the shorter window afterVACUUMis the practical limit. - Timestamps resolve to the latest commit at or before that time; asking for a time before the first commit fails.
- Python and Scala use
.option("versionAsOf", 42)or.option("timestampAsOf", ...)onspark.read. CREATE TABLE ... DEEP CLONE src VERSION AS OF nmaterialises a historical copy without affecting the source.
Typical uses are auditing (“what did the customer table show when the report ran”), reproducing ML training sets, diffing versions to debug a pipeline, and recovering from an accidental DELETE or a bad MERGE in seconds instead of restoring backups.
44In a real project using Databricks, how would you apply, test, or troubleshoot time travel and rollback?
Apply. In a pricing data mart I would record the Delta version of each input table in the job’s run metadata (via DESCRIBE HISTORY or DeltaTable.history()), so any published price list can be regenerated bit-for-bit with VERSION AS OF. Finance tables keep deletedFileRetentionDuration at 30 days to cover month-end investigations. Rollback is a documented runbook step: a bad load is reverted with RESTORE TABLE ... TO VERSION AS OF n, then the fixed job reruns, rather than engineers hand-writing compensating deletes.
Test. Pipeline tests capture the version before a run and use EXCEPT queries between VERSION AS OF snapshots to assert exactly the expected rows changed, which doubles as a regression test for the transformation. The restore runbook is rehearsed quarterly in a staging copy: load bad data, restore, verify checksums match the pre-incident version, and verify that downstream streaming readers continue (or are documented as needing a restart).
Troubleshoot. Cannot time travel Delta table to version N means either the log files or the data files were cleaned up; if only the data files are gone, the RESTORE fails with missing files and the alternative is a backup or deep clone. Restores on a table that downstream streams read from cause those streams to fail because RESTORE is not an append; they need skipChangeCommits or a new checkpoint. A surprising “restore changed nothing” is usually a restore to the current version after a misread of history.
The key limitation is that time travel is bounded by retention, so it is a short-term recovery tool, not a substitute for archival snapshots or clones.
45Explain CDC ingestion and deduplication in the context of Databricks.
Change data capture ingestion brings row-level inserts, updates and deletes from an operational database into the lakehouse, usually as a stream of events from Debezium, Azure SQL CDC, Oracle GoldenGate, Fivetran or Qlik landing in Kafka or cloud storage. Each event carries the key, the operation type, the after-image (and sometimes before-image) and a sequencing field such as an LSN, SCN or commit timestamp.
Two problems must be solved. Ordering: events for the same key may arrive out of order or more than once, so the latest state has to be chosen using the sequence column, not arrival time. Deduplication: retries and connector restarts produce exact duplicates, and only one copy may be applied.
This diagram shows the path from source database to silver table.

On Databricks there are two standard implementations:
- Lakeflow pipelines
AUTO CDC INTO(formerlyAPPLY CHANGES INTO) declares keys, the sequence column, the delete condition and SCD type 1 or 2, and the engine handles ordering, late events and dedup. - Hand-written Structured Streaming with
foreachBatch: within each micro-batch, rank by sequence per key, keep the top row, thenMERGEinto the silver table; cross-batch duplicates are handled because theMERGEcompares the stored sequence value.
CREATE OR REFRESH STREAMING TABLE silver.customers;
CREATE FLOW customers_cdc AS AUTO CDC INTO silver.customers
FROM STREAM bronze.customers_cdc
KEYS (customer_id)
APPLY AS DELETE WHEN op = 'd'
SEQUENCE BY lsn
COLUMNS * EXCEPT (op, lsn)
STORED AS SCD TYPE 2;
Delta’s Change Data Feed (delta.enableChangeDataFeed) then exposes the silver table’s own changes to downstream consumers in the same event shape.
46In a real project using Databricks, how would you apply, test, or troubleshoot CDC ingestion and deduplication?
Apply. Replicating a 400-table ERP into the lakehouse, I would land Debezium topics into bronze streaming tables unchanged, then generate one AUTO CDC INTO flow per table from metadata (keys and sequence column read from a config table) so the pipeline is driven by configuration rather than 400 hand-written notebooks. Hot tables with soft deletes use APPLY AS DELETE WHEN op = 'd', dimensions that need history use SCD type 2 with TRACK HISTORY ON for selected columns, and a watermark on the bronze event time bounds state.
Test. A replay test injects a scripted sequence per key: insert, two out-of-order updates, a duplicate of the last update, then a delete. Assertions check that silver holds the final state after each micro-batch, that SCD type 2 rows have correct __START_AT / __END_AT, and that the duplicate did not create an extra history row. Daily reconciliation compares row counts and a hash of business columns against the source database per table, and an alert fires if the lag between the latest source LSN and the latest applied LSN exceeds an SLA.
Troubleshoot. The commonest defect is choosing the wrong sequence column (a non-monotonic updated_at from application code) so late-arriving events overwrite newer ones; the fix is sequencing by the log position, with a tuple STRUCT(lsn, ts) when needed. Snapshot-plus-stream initial loads cause duplicates when the snapshot and first streamed events overlap; running both through the same merge with the sequence column resolves it. Missing deletes almost always mean the connector emits tombstone records that were filtered out as nulls in bronze.
Deleting a bronze CDC topic’s retention before the first silver load has completed is unrecoverable, so retention must exceed the longest expected replay.
47Explain orchestration with ADF in the context of Databricks.
Azure Data Factory (and its successor inside Microsoft Fabric, Data Factory pipelines) is often the enterprise orchestrator around Databricks: it handles scheduling, copying data from hundreds of on-premises and SaaS sources via linked services and self-hosted integration runtimes, and then invokes Databricks to do the heavy transformation.
Integration points:
- Databricks Notebook, Python and JAR activities run code on a linked service pointing at a workspace, either on a new job cluster defined in the linked service or an existing cluster; parameters flow in as base parameters and out via
dbutils.notebook.exit. - Databricks Job activity (newer) triggers an existing Lakeflow Job by id, so the DAG, cluster and retries stay defined in Databricks and ADF only sequences and monitors it. This is the recommended approach because it respects job-level settings and Asset Bundles.
- Web activity calling the Jobs REST API (
/api/2.2/jobs/run-now) with a managed identity or service principal token for anything the built-in activities do not cover. - Authentication through ADF’s system-assigned managed identity granted access to the workspace, avoiding stored tokens.
This diagram shows the typical hand-off.

Where the whole estate lives in Databricks, Lakeflow Jobs alone is simpler; ADF earns its place when ingestion spans many non-Databricks systems or a central team already standardises on it.
48In a real project using Databricks, how would you apply, test, or troubleshoot orchestration with ADF?
Apply. For a manufacturer with 60 on-premises sources, I would keep ADF as the control tower: metadata-driven Copy activities land files in ADLS, then a single Databricks Job activity (authenticated with ADF’s managed identity, which is added to the workspace as a service principal) triggers a Lakeflow Job that owns the transformation DAG. ADF passes run_date and source_system as job parameters and reads the result status; alerting and run history stay in ADF for the operations team, while cluster configuration, retries and task dependencies stay in Databricks Asset Bundles.
Test. Pipeline tests in a dev factory run the Copy activity against a small source and assert the file landed; the Databricks activity is tested by triggering a job that deliberately exits non-zero and confirming ADF marks the run failed and stops downstream activities. Parameter passing is validated end to end by a notebook that writes the received parameters to a table the test inspects. Load-order tests confirm the Databricks activity waits for all parallel copies via dependency conditions.
Troubleshoot. Invalid access token or 403 from the activity means the managed identity is not a workspace user or lacks CAN MANAGE RUN on the job. Runs that succeed in Databricks but show as failed in ADF are typically timeouts on the activity (default 12 hours but often lowered) or the notebook not calling dbutils.notebook.exit. Duplicate job runs appear when ADF retries an activity whose Databricks run is still executing; setting max_concurrent_runs = 1 with queueing on the job prevents overlap.
The main consideration is to avoid defining cluster details in ADF linked services, which bypasses policies and bundles and drifts from the Databricks-side definitions.
49Explain diagnosing slow Spark jobs in the context of Databricks.
Diagnosing a slow Spark job is a top-down exercise: find which stage consumes the time, then why its tasks are slow, then what in the plan or data causes that.
Tools on Databricks:
- Spark UI (Jobs, Stages, SQL/DataFrame tabs): the SQL tab shows the physical plan with per-operator metrics (rows, bytes, spill, time); the Stages tab shows task duration distribution, shuffle read/write and GC time.
- Query profile in Databricks SQL: a graphical plan with time, files read, pruned files and spill per operator.
- Cluster metrics (Ganglia on older runtimes, native metrics UI now): CPU, memory, network and disk per node to tell compute-bound from I/O-bound.
- Driver and executor logs for GC pauses,
OutOfMemoryError, task retries andFetchFailed. - Delta history and
DESCRIBE DETAILfor file counts and sizes.
Common root causes and their signatures:
| Symptom in UI | Likely cause | Fix |
|---|---|---|
| One task far longer than median | Data skew on join or group key | AQE skew join, salting, broadcast |
| High spill (memory/disk) | Too few partitions or small executors | More partitions, larger nodes |
| Thousands of tiny tasks, low CPU | Small files | OPTIMIZE, auto compaction |
| Scan reads whole table | No pruning | Clustering, partition predicates, stats |
| Slow but low CPU, driver busy | Driver-side work: collect, Python loops | Push work into Spark operations |
| Long GC time | Caching too much, wide rows | Unpersist, Photon, memory tuning |
Reading the plan from the bottom up and checking whether each scan, exchange and join did the work expected is usually enough to locate the problem.
50In a real project using Databricks, how would you apply, test, or troubleshoot diagnosing slow Spark jobs?
Apply. With a nightly 6-hour aggregation job that must finish in 2, I would start with the Spark UI’s SQL tab and sort stages by duration. In practice the first two hours of a run like this are typically a sort-merge join between events and a 50 MB dimension table that was never broadcast, with a 20-minute straggler task caused by a NULL join key shared by 30 percent of rows. The remedy is a broadcast() hint or statistics so AQE decides, filtering null keys before the join, replacing a Python UDF with native functions, and enabling Photon; the write side is fixed with liquid clustering on the output table.
Test. Each change is measured in isolation on the same input snapshot (VERSION AS OF) so improvements are attributable; stage duration, shuffle bytes, spill and total DBUs are recorded in a run log table. A regression guard job asserts the production run stays under 2.5 hours and alerts via the job duration threshold notification.
Troubleshoot. When a job that was fine becomes slow with no code change, I compare DESCRIBE DETAIL file counts (small-file growth), check the cluster event log for spot reclamation and autoscaling thrash, and look at system.query.history or run history for concurrent workloads competing for the same cluster. Executor logs full of FetchFailedException point at shuffle service pressure or node loss; OutOfMemoryError on the driver points to collect / toPandas on a large result.
The most frequent misdiagnosis is adding nodes to a job that is driver-bound or skew-bound, which raises cost and changes nothing.
Answers tailored to your resume and job description
Add your resume and the job description in CrackItX's Settings. When the interviewer asks a Databricks question, Claude suggests an answer using your real projects and the role's requirements, in real time.
See pricing →