Top 80 Apache Spark / Kafka / Airflow
interview questions
Distributed processing, streaming, partitions and orchestration. Open a question to read the answer.
01Explain Spark driver executors cluster manager in the context of Apache Spark / Kafka / Airflow.
A Spark application is one driver process plus a set of executor processes, with a cluster manager in between that hands out the machines. The driver runs the main() of the job, owns the SparkSession, converts the program into a DAG of stages and tasks, and schedules those tasks. Executors are JVMs on worker nodes that run the tasks, keep cached partitions in memory and report results and metrics back to the driver. The cluster manager (Standalone, YARN or Kubernetes in Spark 3.5/4.0; Mesos support was removed in 3.x) only allocates containers; it knows nothing about the job’s logic.
The diagram shows the three roles for a job submitted with spark-submit.
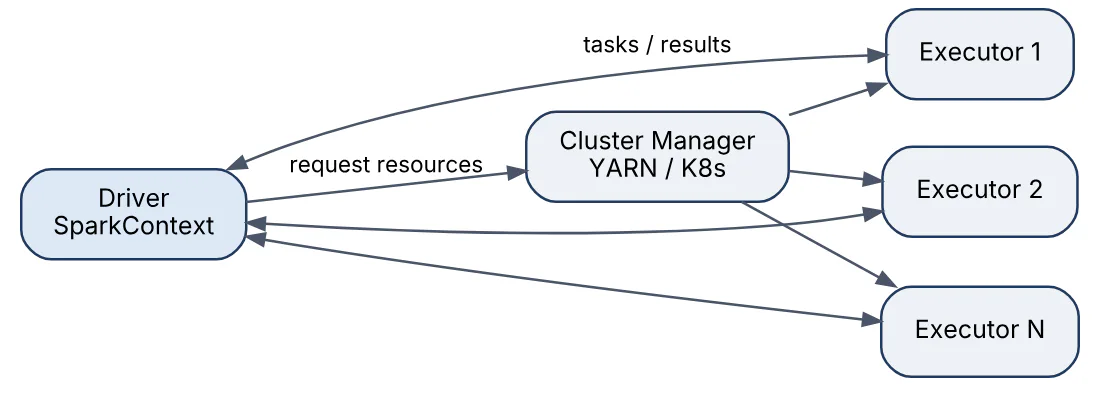
Two practical consequences follow. The driver is a single point of failure and a bottleneck: anything that pulls data back to it (collect(), large broadcasts, huge task counts) can overload it. Executor sizing is set by --executor-cores, --executor-memory and --num-executors (or dynamic allocation), and the cluster manager decides whether the driver itself runs on the client machine (client mode) or inside the cluster (cluster mode), which is what Airflow-triggered jobs normally use so the scheduler host is not holding the driver.
02In a real project using Apache Spark / Kafka / Airflow, how would you apply, test, or troubleshoot Spark driver executors cluster manager?
Apply. In a nightly sales-aggregation pipeline triggered from Airflow with SparkSubmitOperator, I run the job in cluster deploy mode on Kubernetes so the driver pod lives in the cluster, not on the Airflow worker. Sizing starts from the data: about 2 TB of Parquet a night gets executors of 5 cores and 20 GB with dynamic allocation capped at 60, and a 4 GB driver because the job never collects to it. The Airflow task only polls the driver’s status, so a long job does not pin an Airflow worker slot.
Test. Before promoting a config change I run the same job against a 5% sample with the Spark UI’s Executors tab open and check task-time distribution, GC time per executor (should stay under roughly 10% of task time) and that no executor is lost. A CI integration test launches the job with local[4] against fixture data and asserts the output row count and schema.
Troubleshoot. The classic symptom is “Container killed by YARN for exceeding memory limits” or a Kubernetes OOMKilled driver. For executors I raise spark.executor.memoryOverhead first (PySpark and off-heap shuffle buffers live there), then cut cores per executor so fewer concurrent tasks share the heap. For a driver OOM I look for collect(), toPandas() or a very large number of partitions producing too much task metadata, then use spark.driver.maxResultSize as a guard rail.
An important trade-off is that very large executors (more than 5 cores) hurt HDFS/S3 throughput and GC, while tiny ones waste overhead and lose broadcast reuse.
03Explain Spark DataFrames versus RDD in the context of Apache Spark / Kafka / Airflow.
Both are distributed, immutable, lazily evaluated collections, but an RDD is a collection of arbitrary JVM/Python objects manipulated with functions Spark cannot see inside, while a DataFrame is a collection of rows with a known schema manipulated with expressions the Catalyst optimizer can analyse and rewrite.
| Aspect | RDD | DataFrame / Dataset |
|---|---|---|
| Schema | None; opaque objects | Columns with types, inferred or declared |
| Optimisation | None; runs what you wrote | Catalyst rewrites plan, Tungsten codegen |
| PySpark cost | Python pickling per record | Columnar, JVM-side execution, Arrow for UDFs |
| API | map, reduceByKey, closures | SQL, select, groupBy, join |
| Use today | Custom partitioning, legacy code | Default for ETL, SQL, streaming |
rdd = sc.textFile("orders.csv").map(lambda l: l.split(","))
total = rdd.map(lambda f: (f[1], float(f[3]))).reduceByKey(lambda a, b: a + b)

df = spark.read.option("header", True).csv("orders.csv")
total_df = df.groupBy("customer_id").agg(F.sum("amount"))
The DataFrame version can push down column pruning to the reader and choose a hash aggregate; the RDD version serialises every row through Python. Datasets (typed DataFrames) exist only on the JVM side. RDDs still underpin everything, and df.rdd is the escape hatch when a transformation genuinely cannot be expressed with built-in functions.
04In a real project using Apache Spark / Kafka / Airflow, how would you apply, test, or troubleshoot Spark DataFrames versus RDD?
Apply. In a clickstream enrichment job that reads Kafka into Structured Streaming, everything is DataFrame-based: from_json with an explicit schema, joins to a broadcast dimension table and groupBy windows. The one place I kept RDD-level code was a legacy geohash library with a custom partitioner; I wrapped it in a mapPartitions call and converted straight back with createDataFrame(rdd, schema) so the rest of the pipeline stayed optimisable.
Test. Unit tests build small DataFrames with spark.createDataFrame inside a local[2] session fixture and compare results with assertDataFrameEqual (added in Spark 3.5’s pyspark.testing). For performance regressions I compare df.explain("formatted") output in CI: if a change makes a Python UDF appear where a native expression used to be, the review flags it.
Troubleshoot. The usual symptom is a PySpark job that is five to ten times slower than expected and shows BatchEvalPython in the plan. Each row is being pickled to a Python worker. The fix is replacing the lambda with built-in pyspark.sql.functions, or, if logic must stay in Python, a vectorised pandas_udf so Arrow batches cross the boundary instead of rows. A second symptom is AnalysisException: cannot resolve column, which almost always means an inferred schema differs between environments; declaring the schema explicitly removes the drift.
The consideration people miss is that df.rdd materialises Row objects and discards the optimised plan, so dropping to RDDs mid-pipeline forfeits predicate pushdown for everything downstream.
05Explain lazy evaluation and DAG in the context of Apache Spark / Kafka / Airflow.
Spark does not execute a transformation when it is called. filter, select, join and groupBy only append a node to a logical plan; nothing runs until an action such as count(), write(), collect() or foreachBatch forces a result. At that moment the driver turns the accumulated plan into a DAG (directed acyclic graph) of stages, each a chain of tasks that can run without moving data, and submits the stages in dependency order.
Laziness is what makes optimisation possible: Spark sees the whole pipeline before running it, so it can prune columns the final output never uses, push filters down to the file reader, merge consecutive maps into one pass, and skip work entirely if an action only needs part of the data.
orders = spark.read.parquet("s3://lake/orders")      # nothing read yet
big = orders.filter("amount > 1000").select("id", "amount")
big.count()                                           # job 1 runs here
big.write.parquet("s3://lake/big_orders")             # job 2: recomputed
The second action recomputes the whole lineage unless big is cached, which is the most common lazy-evaluation surprise. Note that “DAG” means something different in Airflow, where it is the workflow definition of tasks; in Spark it is the physical execution graph of one job. Spark’s DAG is visible per job in the Spark UI’s “DAG Visualization”.
06In a real project using Apache Spark / Kafka / Airflow, how would you apply, test, or troubleshoot lazy evaluation and DAG?
Apply. In a reporting pipeline that reads raw events once and writes four aggregates, laziness means each write would re-read and re-parse the source. I structure the job so the shared, expensive part (parse, deduplicate, join to dimensions) is computed once and persisted, then each aggregate branches from it, and I unpersist at the end. I also keep validation actions such as count() out of the hot path, because every one of them is a full job; a single write followed by reading the output’s metadata is cheaper.
Test. I inspect df.explain(True) in a notebook to confirm filters reach the scan node (PushedFilters: [IsNotNull(amount), GreaterThan(amount,1000)]) and that partition pruning on the date column is applied. In CI a test counts Spark jobs via a SparkListener (or sc.statusTracker()) for a fixture run and fails if the number grows, which catches accidental extra actions.
Troubleshoot. The symptom is a job that “does nothing for ten minutes and then fails on the last line”. The error surfaces at the action, not where the bug is. I read the stack trace for the transformation name, then bisect by caching an intermediate DataFrame and calling count() on it to localise the failure. Another symptom is the same stage appearing in several jobs in the Spark UI, which is recomputation of an uncached lineage.
The trade-off is that caching to avoid recomputation costs memory and can itself cause spills, so I cache only what is reused more than once and is expensive to rebuild.
07Explain narrow versus wide transformations in the context of Apache Spark / Kafka / Airflow.
The distinction is about where the input of each output partition comes from. In a narrow transformation each output partition depends on exactly one input partition, so it can run inside the same task with no data movement: map, filter, select, withColumn, union, and mapPartitions. In a wide transformation an output partition needs data from many input partitions, so Spark must redistribute records across the cluster by key, which is a shuffle: groupBy, reduceByKey, distinct, join (except broadcast joins), repartition, orderBy and window functions partitioned by a key.
Narrow transformations are pipelined: a chain of them becomes one stage and a record flows through the whole chain in memory. Every wide transformation ends a stage, forces all upstream tasks to finish, writes shuffle files to local disk and reads them over the network in the next stage.
The diagram shows narrow steps pipelined inside one stage and the shuffle that separates it from the next.

df.filter("status = 'PAID'")          # narrow
  .withColumn("eur", F.col("amt") * 0.92)  # narrow, same stage
  .groupBy("country").sum("eur")      # wide: shuffle, new stage
  .coalesce(1)                        # narrow: merges partitions, no shuffle
coalesce is narrow because it only merges partitions on the same executor; repartition is wide because it hashes every row to a new location. The practical rule in performance work is that the number of wide transformations, not the number of lines of code, determines how expensive a job is.
08In a real project using Apache Spark / Kafka / Airflow, how would you apply, test, or troubleshoot narrow versus wide transformations?
Apply. When designing a daily customer-360 build, I group operations so that all keyed work on the same key happens after one shuffle: pre-partition orders and payments by customer_id once, then run the join, the aggregation and the dedup in a single stage rather than shuffling three times. Dimension lookups become broadcast joins so they stay narrow. For streaming from Kafka, I pick the Kafka partition key to match the downstream aggregation key, which lets groupBy on that key often avoid a second redistribution in foreachBatch logic.
Test. The Spark UI’s SQL tab shows every Exchange node; I compare the count of exchanges before and after a change on the same sample. In CI, a test calls df.explain() and asserts the plan string contains at most N Exchange operators for the critical query, which prevents someone from reintroducing a shuffle with an innocent-looking distinct().
Troubleshoot. The symptom is a stage with thousands of tasks that each read a few hundred kilobytes of shuffle data and a job time dominated by “Shuffle Read” and “Shuffle Write” metrics. I look at the plan for unnecessary exchanges: repartition() used where coalesce() would do, an orderBy applied before a limit without being needed, or a distinct on already-unique data. Removing the operator or replacing a join with a broadcast fixes it.
The consideration is that avoiding a shuffle is not always right: coalesce(1) before a write removes a shuffle but serialises the whole write onto one task.
09Explain shuffle and stage boundaries in the context of Apache Spark / Kafka / Airflow.
A shuffle is the all-to-all redistribution of data by key between two sets of tasks, and a stage boundary is where Spark cuts the DAG because of it. Within a stage, tasks are independent and run in parallel; at a boundary, every map-side task must finish writing its shuffle output before any reduce-side task can start, which is why a single slow task in stage 1 delays the whole of stage 2.
The mechanics: each map task sorts or hashes its records into one bucket per downstream partition and writes them to local disk as shuffle files (one data file plus an index file per task in the sort-based shuffle). Reduce tasks then fetch their bucket from every map task over the network. The number of reduce partitions is spark.sql.shuffle.partitions (default 200) unless adaptive query execution coalesces them.
The diagram shows one boundary: three map tasks feeding two reduce tasks through local shuffle files.
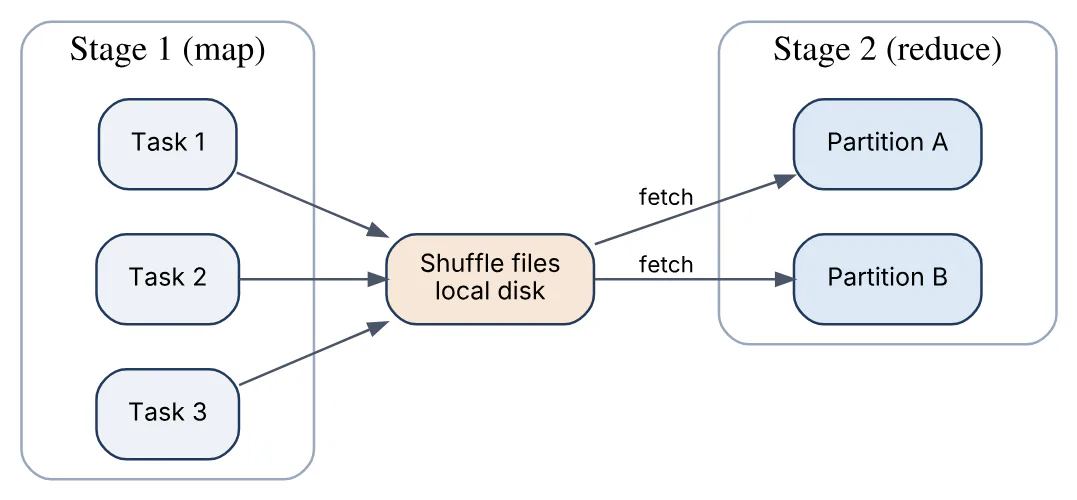
Shuffle files also give fault tolerance: if a reduce task dies, it refetches rather than recomputing the map stage, as long as the executor holding the files is alive (or an external shuffle service holds them). Shuffle cost is disk I/O, serialisation and network, which is why it dominates most Spark job runtimes.
10In a real project using Apache Spark / Kafka / Airflow, how would you apply, test, or troubleshoot shuffle and stage boundaries?
Apply. For a 3 TB daily join of events to sessions I size the shuffle deliberately: enable AQE (spark.sql.adaptive.enabled, on by default since 3.2) so partitions are coalesced after the map stage, set spark.sql.adaptive.advisoryPartitionSizeInBytes to 128 MB, and run executors on Kubernetes with the shuffle written to fast local NVMe rather than network volumes. For jobs that run on spot nodes I enable spark.decommission.enabled with shuffle block migration so a reclaimed node hands off its shuffle files instead of forcing a stage retry.
Test. In staging I run the job on a full-size day and check the Stages tab: shuffle write per stage, spill (memory and disk) per task, and the task duration distribution. A healthy stage shows a median close to the max; spill above zero means spark.sql.shuffle.partitions or executor memory is too small for that stage. I record these numbers in the run’s Airflow task log so trends are visible.
Troubleshoot. FetchFailedException or “Connection reset by peer” during shuffle read usually means an executor that held shuffle files was lost, often from an OOM kill, so Spark reruns the parent stage. I check the executor log for the kill reason, raise memory overhead and, on YARN, enable the external shuffle service so files survive executor loss. Shuffle stages with 200 tiny tasks on small data point to a fixed shuffle.partitions with AQE disabled.
The important consideration is that shuffle files live on local disk; undersized ephemeral storage on Kubernetes pods leads to “No space left on device” long before memory is exhausted.
11Explain partition sizing in the context of Apache Spark / Kafka / Airflow.
Partition sizing is choosing how many pieces a dataset is split into at each point in a Spark job, because a partition is the unit of parallelism and of memory per task. Too few partitions and the cluster sits idle while a handful of tasks process gigabytes each, spilling to disk or failing with OOM. Too many and the scheduler spends its time on task overhead and produces thousands of tiny output files.
Three settings drive it:
- Input partitions come from the source: for files,
spark.sql.files.maxPartitionBytes(default 128 MB) governs how many splits a scan produces; for Kafka, one Spark partition per Kafka topic partition unlessminPartitionsis set. - Shuffle partitions:
spark.sql.shuffle.partitions(default 200) fixes the output count of every wide transformation; AQE can coalesce these downward at runtime, targetingadvisoryPartitionSizeInBytes(64 MB default). - Output partitions:
repartition(n)orcoalesce(n)beforewrite, orrepartition(col)so each output file holds one partition-key value.
The working target is 100–200 MB of uncompressed data per task and a total task count of two to four times the executor core count, so stragglers can be balanced. For a 1 TB shuffle with 400 cores that means roughly 5,000–8,000 partitions, not 200. In Spark 3.5/4.0 the practical approach is to leave AQE on for shuffle sizing and control input and output sizes explicitly.
12In a real project using Apache Spark / Kafka / Airflow, how would you apply, test, or troubleshoot partition sizing?
Apply. In a lakehouse ingestion job that lands hourly Kafka data as Parquet partitioned by dt and hour, the Kafka read gives us 48 partitions (one per topic partition), which is far too few to parse 200 GB an hour on 300 cores. I set minPartitions=600 on the Kafka source so Spark splits offset ranges. Before the write I repartition("dt", "hour") combined with spark.sql.files.maxRecordsPerFile so each hour folder gets files of about 256 MB instead of 600 shards of 300 KB. Airflow passes the target partition count as a DAG parameter so a backfill run with more data can scale it.
Test. A validation task in the same Airflow DAG lists the written files and asserts the median size is within a band (say 128–512 MB) and the file count per hour is below a limit; failing that fails the run before downstream consumers read it. In the Spark UI I look at “Input Size / Records” per task to confirm tasks are balanced.
Troubleshoot. Downstream Athena or Trino queries getting slower every week is the classic small-files symptom; aws s3 ls --summarize shows millions of tiny objects. The fix is a compaction job plus corrected output partitioning. The opposite symptom, a few tasks running for an hour with heavy spill while the rest finish in seconds, means input splits too large or partition keys with skew; raising maxPartitionBytes down (smaller splits) or adding a salt column addresses it.
The consideration is that coalesce after a large shuffle can push many shuffle partitions into one task and reintroduce the OOM you were avoiding.
13Explain broadcast joins in the context of Apache Spark / Kafka / Airflow.
A broadcast join avoids shuffling the large side of a join by sending a complete copy of the small side to every executor. Each task then performs a local hash lookup against the in-memory copy, so the join becomes a narrow operation and adds no stage boundary. Spark picks this plan automatically when one side’s estimated size is below spark.sql.autoBroadcastJoinThreshold (default 10 MB), and AQE in Spark 3.x can switch a planned sort-merge join to a broadcast join at runtime once actual shuffle statistics show a side is small. You can force it with a hint.
from pyspark.sql.functions import broadcast

enriched = orders.join(broadcast(countries), "country_code")
  # SQL hint: SELECT /*+ BROADCAST(c) */ ... FROM orders o JOIN countries c
The diagram contrasts the two strategies: the sort-merge join shuffles both inputs, the broadcast join moves only the small table.
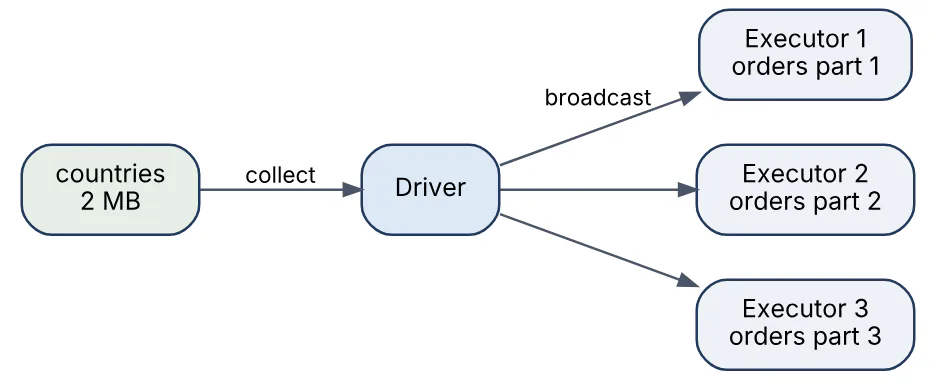
The cost is that the small table is collected to the driver and then held in every executor’s memory, so a “small” table of a few hundred megabytes can OOM the driver or crowd out execution memory. The threshold is based on statistics, which are often missing or stale for Parquet without ANALYZE TABLE, so Spark may estimate wrongly in either direction.
14In a real project using Apache Spark / Kafka / Airflow, how would you apply, test, or troubleshoot broadcast joins?
Apply. In a streaming fraud-scoring job reading card transactions from Kafka, each micro-batch joins to a merchant dimension (around 400,000 rows, 40 MB) and a currency table. Both are broadcast. Because Structured Streaming re-plans each batch, I load the dimension as a static DataFrame and reload it on a schedule using an Airflow-triggered refresh that writes a new snapshot path; the stream picks it up via a foreachBatch that reads the latest path. For the batch warehouse jobs I raise autoBroadcastJoinThreshold to 100 MB on executors of 16 GB and keep ANALYZE TABLE ... COMPUTE STATISTICS in the Airflow DAG after each dimension load so the optimiser’s estimates are current.
Test. explain() must show BroadcastHashJoin (or BroadcastNestedLoopJoin only when intended) for the dimension joins; a CI check greps the plan. I also run the job with the dimension artificially inflated ten times to confirm it degrades to a sort-merge join rather than crashing.
Troubleshoot. “Total size of serialized results … is bigger than spark.driver.maxResultSize” or a driver OOM during a join means a side that is too large is being broadcast, usually because a filter was expected to shrink it and did not, or statistics were wrong. I either add a MERGE hint or set the threshold to -1 for that query. The reverse problem, a slow sort-merge join on an obviously small table, is fixed with an explicit broadcast() hint. A timeout spark.sql.broadcastTimeout (300 s) during a slow collect points at the same root cause.
The consideration is that a broadcast variable is re-sent for every job, so in a streaming job a large broadcast is paid on every micro-batch.
15Explain Spark caching and persistence in the context of Apache Spark / Kafka / Airflow.
Caching tells Spark to keep the partitions of a DataFrame or RDD after the first action computes them, so later actions reuse the stored partitions instead of re-running the lineage. cache() is shorthand for persist() with the default level, which for DataFrames is MEMORY_AND_DISK (deserialised in memory, spilling to local disk when the storage pool is full). persist(StorageLevel.X) selects other levels: MEMORY_ONLY (drop partitions that do not fit and recompute them), MEMORY_ONLY_SER / _SER variants that trade CPU for less memory on the JVM, DISK_ONLY, and _2 replicated variants.
Key behaviours:
- Caching is itself lazy; nothing is stored until an action runs, and only partitions touched by that action are stored.
- The storage pool shares executor memory with execution (shuffle, sort) under the unified memory manager;
spark.memory.storageFraction(0.5) is only a soft protection for cached blocks against eviction. - Cached data is tied to the executors; if an executor dies its blocks are lost and recomputed unless replicated.
unpersist()frees memory; otherwise blocks are evicted LRU or cleared when the application ends.
Checkpointing (next question) differs in that it truncates the lineage and writes to reliable storage. A DataFrame cache is keyed on the analysed plan, so a logically identical query re-expressed elsewhere will also hit the cache, which occasionally surprises people when stale results appear after the underlying table changed.
16In a real project using Apache Spark / Kafka / Airflow, how would you apply, test, or troubleshoot Spark caching and persistence?
Apply. In a daily marketing-attribution job, the cleaned and sessionised event table (about 80 GB after filtering) feeds six downstream aggregations written to different tables. I persist it with MEMORY_AND_DISK, trigger materialisation once with a cheap action, fan out the six writes, then unpersist() before the job’s final export so that memory is available for the last large sort. Iterative algorithms (a graph-propagation loop in a customer-identity job) cache each iteration’s result and unpersist the previous one to stop the lineage and memory growing without bound.
Test. The Storage tab in the Spark UI shows “Fraction Cached” and size in memory versus on disk; I want 100% cached with little on disk, otherwise executors are too small for the dataset. In integration tests I assert via spark.catalog.isCached("view_name") and compare job counts with and without the cache to prove the recomputation is gone.
Troubleshoot. A cached stage that is still being recomputed usually means the cache was defined on a different DataFrame object than the one reused, or an action ran before cache() was called. Executors with heavy GC pauses or “ExecutorLostFailure” after adding a cache mean the storage pool is squeezing execution memory; switching to MEMORY_AND_DISK_SER (or DISK_ONLY for huge tables on NVMe) or caching a narrower projection fixes it. Stale results after a table reload are the plan-keyed cache serving old data; spark.catalog.clearCache() or REFRESH TABLE resolves it.
The consideration is that caching everything “to be safe” is a common anti-pattern: a cache used once costs memory and serialisation and saves nothing.
17Explain Spark SQL Catalyst optimizer in the context of Apache Spark / Kafka / Airflow.
Catalyst is the query optimiser behind every DataFrame, Dataset and SQL operation. It takes the tree of operations you declared and transforms it through four phases before anything runs:
- Analysis resolves column names and types against the catalogue, producing a resolved logical plan (this is where
AnalysisExceptioncomes from). - Logical optimisation applies rule-based rewrites: predicate pushdown, column pruning, constant folding, filter and projection combination, join reordering with cost statistics, and subquery decorrelation.
- Physical planning generates candidate physical plans (for example sort-merge join versus broadcast hash join) and picks one using cost estimates such as table size.
- Code generation (Tungsten) compiles the chosen plan’s operators into a single Java function per stage, so rows flow through tight loops instead of virtual calls per operator.
The pipeline from DataFrame API to execution looks like this.

df.explain("extended") prints all four plans. Because the optimiser can only reason about expressions it understands, Python or Scala UDFs are black boxes that block pushdown and pruning past them, which is the single most common way Catalyst is defeated in practice. Since Spark 3.0 AQE adds a fifth, runtime phase that re-optimises the physical plan between stages.
18In a real project using Apache Spark / Kafka / Airflow, how would you apply, test, or troubleshoot Spark SQL Catalyst optimizer?
Apply. In a finance data mart I write transformations so Catalyst has the most information: filters on partition columns are expressed as literal comparisons rather than inside UDFs, date arithmetic uses built-in functions, and dimension tables are registered in the Hive/Unity catalogue with statistics so cost-based join reordering (spark.sql.cbo.enabled) can choose a good order for five-way joins. The Airflow DAG runs ANALYZE TABLE ... COMPUTE STATISTICS FOR ALL COLUMNS after each load, which is what makes the cost estimates meaningful.
Test. For each critical query I keep a golden explain("formatted") plan under version control and a CI test that diffs the operator structure (not the IDs), so a regression such as a filter no longer appearing in PushedFilters, or a BroadcastHashJoin turning into SortMergeJoin, is caught at review time. I also test UDF-free rewrites against the original with assertDataFrameEqual.
Troubleshoot. When a query that should scan one day’s partition scans the whole table, I read the physical plan’s PartitionFilters line. Common causes are a to_date(cast(dt)) wrapped around the partition column, a UDF in the predicate, or an implicit type cast between string partitions and a date literal. Rewriting the predicate against the raw column restores pruning. Long “planning” time on wide schemas (thousands of columns, deeply nested CASE expressions) is Catalyst itself; splitting the query or checkpointing an intermediate DataFrame to cut the plan size helps.
The important consideration is that Catalyst’s choices are only as good as its statistics, and stale or missing statistics quietly turn cost-based decisions into guesses.
19Explain Spark adaptive query execution in the context of Apache Spark / Kafka / Airflow.
Adaptive query execution (AQE) lets Spark re-optimise the physical plan at runtime using the actual statistics collected at each shuffle boundary, rather than committing to a plan based on estimates before any data is read. It is enabled by default since Spark 3.2 (spark.sql.adaptive.enabled=true) and makes three main adjustments:
- Coalescing shuffle partitions: after a map stage, AQE merges small shuffle partitions so each reduce task gets roughly
advisoryPartitionSizeInBytes(64 MB), which removes the problem of 200 fixed partitions being far too many for small data. - Switching join strategies: if a side of a sort-merge join turns out to be under the broadcast threshold once it has actually been materialised, AQE replaces it with a broadcast hash join, avoiding the second shuffle and sort.
- Skew join handling: when one shuffle partition is much larger than the median (
skewedPartitionFactor5 andskewedPartitionThresholdInBytes256 MB), AQE splits it into several tasks and replicates the matching partition of the other side.
In Spark 3.5 and 4.0 it also propagates empty relations and can rebalance partitions before writes (spark.sql.adaptive.coalescePartitions.enabled with hint REBALANCE). The Spark UI marks adaptive plans with AdaptiveSparkPlan and shows both the initial and final plan.
AQE only acts at stage boundaries, so a plan with no shuffle gains nothing from it, and it does not change the number of input partitions from the file scan. Setting spark.sql.shuffle.partitions high (several thousand) is safe with AQE because unneeded partitions are coalesced away.
20In a real project using Apache Spark / Kafka / Airflow, how would you apply, test, or troubleshoot Spark adaptive query execution?
Apply. For a nightly set of 40 warehouse jobs orchestrated by Airflow with sizes from 1 GB to 5 TB, AQE replaced per-job tuning of shuffle.partitions. I set a single cluster default of 2,000 shuffle partitions and an advisory size of 128 MB; small jobs are coalesced to a handful of tasks and the big ones keep their parallelism. For jobs that write to Delta or Iceberg tables I add .hint("rebalance", "dt") before the write so AQE produces evenly sized output files per date. Skew-join handling is left on so an occasional hot customer key does not require code changes.
Test. The SQL tab shows the AdaptiveSparkPlan with “isFinalPlan=true” and the actual number of post-coalesce partitions; I compare this to the pre-AQE run on the same data and check stage durations and spill. A regression test runs a known-skewed fixture and asserts the final plan contains isSkew=true on the join and that no task’s duration exceeds three times the median.
Troubleshoot. If a job still produces 2,000 tiny files, AQE’s coalescing was bypassed, usually by an explicit repartition(2000) or because spark.sql.adaptive.coalescePartitions.enabled was turned off in a legacy config. If a skewed join remains slow, the skew is on a broadcast or on a non-shuffle join type AQE does not split, or the partition is below the 256 MB threshold while still slow because of a heavy UDF; lowering skewedPartitionThresholdInBytes or salting manually fixes it. An unexpected BroadcastHashJoin OOM can be the runtime join switch broadcasting a side slightly under the threshold; lowering the threshold for that job solves it.
The consideration is that AQE’s final plan is only known after execution, so explain() before running shows the initial plan and can mislead a reviewer.
21Explain Spark skew and salting in the context of Apache Spark / Kafka / Airflow.
Data skew is an uneven distribution of records across partitions after a shuffle, so that one or a few tasks process far more data than the rest. Because a stage finishes only when its slowest task does, one hot key (a NULL customer ID, a default country, a bot account producing half the events) can turn a 10-minute stage into a 3-hour one, and that task’s partition may not fit in memory at all. Skew shows up in the Spark UI as a stage whose max task duration and shuffle read are many times the median.
Salting is the manual remedy: append a random component to the hot key so its records spread over N partitions, then undo the effect on the other side of the operation.
from pyspark.sql import functions as F
N = 16
events_s = events.withColumn("salt", (F.rand() * N).cast("int"))
dims_s = (dims.withColumn("salt", F.explode(F.array([F.lit(i) for i in range(N)]))))
joined = events_s.join(dims_s, ["customer_id", "salt"]).drop("salt")
The large skewed side gets a random salt; the small side is replicated N times, one copy per salt value, so every salted key still finds its match. For aggregations the equivalent is a two-phase groupBy(key, salt) followed by groupBy(key).
Alternatives are AQE skew-join handling (automatic, for sort-merge joins only), broadcasting the small side so no shuffle on the hot key occurs, filtering out and separately handling NULL keys, or isolating the few hot keys into their own broadcast join. Salting multiplies the size of the replicated side by N, so N should be the smallest number that balances the stage.
22In a real project using Apache Spark / Kafka / Airflow, how would you apply, test, or troubleshoot Spark skew and salting?
Apply. In an ad-tech pipeline joining 10 billion impressions to a campaign table, 30% of impressions carried the same “untracked” campaign ID. I split the DataFrame: rows with the hot key are joined to the single matching campaign row via a broadcast (no shuffle), and the remaining rows go through the normal sort-merge join; the two results are unioned. For a second skew on user_id aggregation where no key dominated but a long tail of bots existed, I used two-phase salted aggregation with N=32. In the Kafka source the same skew appeared as one partition receiving most traffic, which I fixed upstream by changing the producer’s partitioning key.
Test. A data-profile task in the Airflow DAG computes the top 20 key frequencies on a sample and writes them to the run log; a threshold alert fires when any key exceeds 5% of rows. In Spark, I confirm the fix by checking that the stage’s max task time is within two times its median and that no single task’s shuffle read exceeds a few hundred megabytes.
Troubleshoot. The signature is 199 tasks done in a minute and one task running for an hour with high shuffle spill, often ending in ExecutorLostFailure because that one partition blew the heap. I find the key with a quick groupBy(key).count().orderBy(desc("count")) on the input, then decide between filtering, broadcasting, AQE tuning or salting. If AQE was expected to handle it, I verify the join was a sort-merge join and the partition exceeded skewedPartitionThresholdInBytes.
The consideration is that salting changes the physical layout, so a downstream groupBy on the original key will shuffle again; salt only the operation that needs it.
23Explain Spark structured streaming in the context of Apache Spark / Kafka / Airflow.
Structured Streaming is Spark’s stream-processing engine built on the DataFrame API: an unbounded input is treated as a table that grows, and the same select, join, groupBy and window expressions used in batch are applied incrementally. The engine runs micro-batches by default (each batch is a small Spark job, latency around a few hundred milliseconds to seconds) or, for simple stateless pipelines, in continuous mode with roughly millisecond latency. Kafka is the dominant source: Spark tracks Kafka offsets itself, one Spark partition per topic partition, and commits progress to its own checkpoint rather than to Kafka consumer-group offsets.
events = (spark.readStream.format("kafka")
          .option("kafka.bootstrap.servers", "b1:9092")
          .option("subscribe", "orders").option("startingOffsets", "latest").load())
value = F.col("value").cast("string")
parsed = (events.select(F.from_json(value, schema).alias("o"))
          .select("o.*"))
counts = (parsed.withWatermark("ts", "10 minutes")
          .groupBy(F.window("ts", "5 minutes"), "country").count())
query = (counts.writeStream.outputMode("update").format("delta")
         .option("checkpointLocation", "s3://ckpt/orders_counts").start())
Core concepts: output modes (append, update, complete), watermarks bounding how late data may arrive so state can be dropped, stateful operators (windowed aggregation, stream-stream joins, deduplication, applyInPandasWithState and the Spark 4.0 transformWithState API), and triggers (processingTime, availableNow for incremental batch runs). End-to-end exactly-once delivery holds when the source is replayable and the sink is idempotent or transactional (Delta, Iceberg, file sinks); the Kafka sink is at-least-once.
The availableNow trigger is how Airflow fits in: a scheduled DAG runs the stream as a bounded job that processes whatever has arrived since the last checkpoint and exits.
24In a real project using Apache Spark / Kafka / Airflow, how would you apply, test, or troubleshoot Spark structured streaming?
Apply. For a payments platform I run a long-lived Structured Streaming job on Kubernetes reading three Kafka topics, deduplicating on payment_id with a 24-hour watermark, joining to a slowly changing merchant table, and writing to a Delta table with foreachBatch so that each micro-batch does an idempotent MERGE. Airflow is not the runtime for the stream; it owns the surrounding tasks: deploying a new version (stop, deploy, restart from the same checkpoint), compaction of the Delta table, and a availableNow variant for backfills of historical topics.
Test. Unit tests use the MemoryStream (Scala) or rate source and MemorySink to feed a sequence of events, including late and duplicate ones, and assert the output after each processAllAvailable(). An end-to-end test in CI starts Kafka with Testcontainers, produces 10,000 messages and asserts the Delta table contains exactly 10,000 distinct payment_ids after the stream processes them. In staging I load-test with a producer at twice the expected rate and watch inputRowsPerSecond versus processedRowsPerSecond.
Troubleshoot. Rising batch duration with stable input means the job cannot keep up; the StreamingQueryListener metrics show which operator grew, usually state size from a missing or too-long watermark, so I check numRowsTotal in state and tighten the watermark or move state to RocksDB (spark.sql.streaming.stateStore.providerClass). “Offsets out of range” after a long outage means Kafka retention expired the committed offset; failOnDataLoss=false lets the job resume with explicit acknowledgement of the gap.
The consideration is that changing the query’s stateful operators or the schema of state is incompatible with the existing checkpoint, so such a deploy needs a new checkpoint and a reprocessing plan.
25Explain Spark checkpointing in the context of Apache Spark / Kafka / Airflow.
Checkpointing writes Spark’s state to reliable storage (HDFS, S3, ADLS) so that it can be recovered or so that lineage no longer has to be kept. There are two different mechanisms with the same name.
Streaming checkpoints are mandatory for any Structured Streaming query with fault-tolerance requirements. The checkpointLocation directory holds a write-ahead log of offsets per micro-batch, a commit log of completed batches, and the state store snapshots and deltas for stateful operators. On restart the query reads the last committed batch, re-reads the same Kafka offsets, and replays the uncommitted batch, which is what gives exactly-once semantics with idempotent sinks. The checkpoint is bound to the query’s logic: the source, the number and type of stateful operators, and the state schema must stay compatible or the restart fails.
The diagram shows what a micro-batch writes to the checkpoint and what a restart reads back.
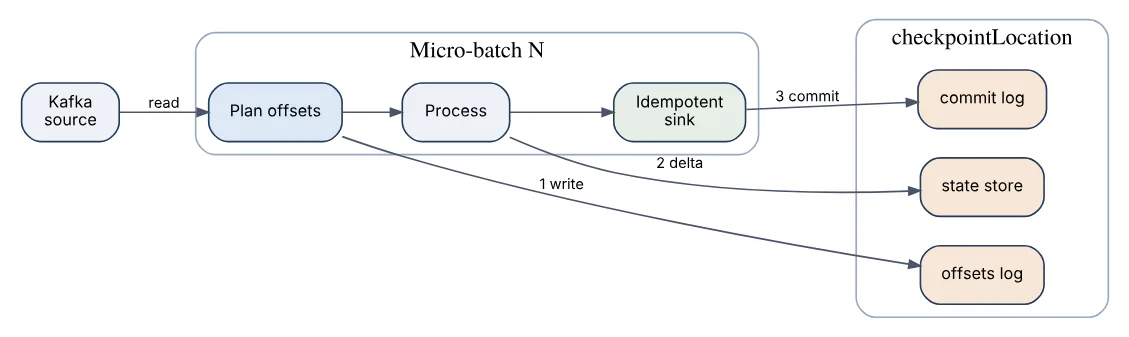
RDD/DataFrame checkpointing (df.checkpoint(), rdd.checkpoint() after sc.setCheckpointDir(...)) materialises a dataset to the checkpoint directory and cuts its lineage. It is used in iterative algorithms where the plan would otherwise grow with every iteration and in jobs with extremely long or complex plans that make Catalyst slow. localCheckpoint() writes to executor local storage, which is faster but not fault tolerant. Spark 4.0 adds checkpoint() support in Spark Connect clients.
| Aspect | Streaming checkpoint | df.checkpoint() |
|---|---|---|
| Purpose | Recovery and exactly-once progress | Cut lineage, materialise |
| Contents | Offsets, commits, operator state | Serialised partitions |
| Lifetime | Across restarts of the same query | Within one application |
Unlike cache(), a checkpointed dataset survives executor loss and does not depend on the plan that produced it.
26In a real project using Apache Spark / Kafka / Airflow, how would you apply, test, or troubleshoot Spark checkpointing?
Apply. For the payments stream, each query has its own checkpoint path on S3 under a versioned prefix (.../orders_merge/v3), never shared between queries. Deploys that preserve query semantics (bug fix in a non-stateful projection, resource changes) restart against the same path; deploys that change stateful logic start a new path with startingOffsets set from the last committed offsets of the old checkpoint, which an Airflow task extracts from the old offsets/ directory. In the batch identity-resolution job, which iterates connected components for up to 20 rounds, I call df.checkpoint() every five iterations to keep the plan small.
Test. An integration test kills the streaming job mid-batch (query.stop() after a controlled number of records), restarts it with the same checkpoint and asserts that the sink has no duplicates and no gaps. For the batch job I compare runtime per iteration with and without checkpointing to prove the plan growth was the cost. A nightly Airflow check lists the checkpoint directory and alerts if the commits/ count has not advanced, which is an early indicator of a stalled stream.
Troubleshoot. IllegalStateException: ... state schema not compatible or “Cannot find offset log” after a deploy means the query changed incompatibly or the path was altered; the fix is a new checkpoint with controlled offsets. Slow batches with heavy S3 write time point to state store snapshots being large; switching to the RocksDB provider with changelog checkpointing (Spark 3.4+) reduces the per-batch upload. Stale, growing state/ directories come from forgetting spark.sql.streaming.minBatchesToRetain defaults versus very frequent triggers.
The consideration is that S3 is eventually consistent for listing in some setups, so the checkpoint location should be a path the platform guarantees strongly consistent (modern S3 is, but older HDFS-compatible stores may not be).
27Explain Spark write modes in the context of Apache Spark / Kafka / Airflow.
The write mode tells DataFrameWriter what to do when the target path or table already exists. There are four values for df.write.mode(...):
| Mode | Behaviour when target exists | Typical use |
|---|---|---|
errorifexists (default) | Throws AnalysisException | Safety default, first-time loads |
append | Adds new files/rows alongside existing data | Incremental loads, event logs |
overwrite | Deletes existing data, writes new | Full refresh of a table or partition |
ignore | Writes nothing, no error | Idempotent “create if missing” |
Two refinements matter in production. Dynamic partition overwrite (spark.sql.sources.partitionOverwriteMode=dynamic) makes overwrite on a partitioned table replace only the partitions present in the DataFrame instead of truncating the whole table, which is how a daily Airflow run rewrites one dt= partition safely. Table formats change the picture: with Delta Lake or Apache Iceberg, overwrite is a transactional operation (old files remain until vacuum, readers never see a half-written state), and additional operations such as MERGE INTO, replaceWhere and overwritePartitions exist for upserts.
Streaming uses output modes instead (append, update, complete), a different concept describing which result rows are emitted per batch. For plain Parquet on S3, overwrite is not atomic: the directory is deleted and then written, so a concurrent reader can see an empty or partial table, and a failed job leaves it empty. That is the main reason teams move to a table format for anything readers depend on.
28In a real project using Apache Spark / Kafka / Airflow, how would you apply, test, or troubleshoot Spark write modes?
Apply. In a daily warehouse load orchestrated by Airflow, each run processes a data_interval_start date and must be safe to re-run. For Parquet tables I use overwrite with dynamic partition overwrite so a retry replaces only that day’s partition; for Delta tables I use replaceWhere("dt = '2026-11-05'") or a MERGE keyed on the business key. Append is reserved for immutable event data landed from Kafka with a batch_id column so duplicates from a replay can be detected. New tables are created with the default errorifexists in a separate bootstrap DAG, never in the recurring run.
Test. The core test is idempotence: an integration test runs the load for the same interval twice and asserts the row count and a checksum are unchanged. A second test runs two adjacent intervals and asserts neither overwrote the other’s partition, which catches a missing partitionOverwriteMode setting. Downstream, a Great Expectations or dbt test in the DAG confirms no duplicate keys after an append.
Troubleshoot. A table that is suddenly empty after a job failure is a static overwrite on Parquet that deleted before writing; I switch to a table format or write to a staging path and atomically swap via the metastore. A table that lost all historical partitions after a one-day load is overwrite with the default static partition mode. Duplicate rows after an Airflow retry are an append run twice; the fix is making the write a MERGE or filtering out the batch_id before writing.
The consideration is that overwrite on an Iceberg or Delta table with concurrent writers can fail with a conflict exception, so concurrent partitions should be written with partition-level isolation rather than table-level overwrite.
29Explain Spark memory OOM in the context of Apache Spark / Kafka / Airflow.
An out-of-memory failure in Spark is almost always one of three distinct problems, each with its own region of memory and its own fix. Executor memory is split into the JVM heap (spark.executor.memory) and off-heap overhead (spark.executor.memoryOverhead, default 10% with a 384 MB floor, or spark.executor.memoryOverheadFactor since 3.3). Inside the heap, the unified memory manager reserves 300 MB, gives spark.memory.fraction (0.6) to execution plus storage, and leaves the rest for user objects.
- Executor heap OOM (
java.lang.OutOfMemoryError: Java heap space): a single task’s partition is too big to process, typically from skew, a hugegroupByKeyvalue list, or an oversized broadcast. Fix by adding partitions, salting, or lowering cores per executor so fewer tasks share the heap. - Container killed by the cluster manager (“exceeding memory limits”, Kubernetes
OOMKilled, exit code 137): the JVM stayed within its heap but total process memory exceeded the container limit. Culprits are off-heap buffers, PySpark worker processes (which live entirely outside the JVM heap), and native libraries. Fix by raisingmemoryOverhead, notexecutor.memory. - Driver OOM:
collect(),toPandas(), large broadcasts, or tens of thousands of partitions whose metadata fills the driver. Fix by not collecting, usingmaxResultSizeas a guard, and writing results instead.
The diagram shows where each failure originates within one executor container.
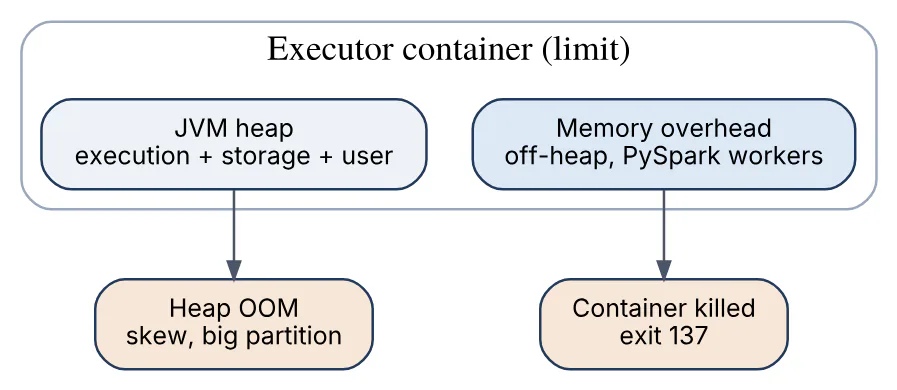
Reading the exact message is the whole diagnosis: a heap error and a container kill need opposite adjustments.
30In a real project using Apache Spark / Kafka / Airflow, how would you apply, test, or troubleshoot Spark memory OOM?
Apply. For PySpark jobs on Kubernetes I budget memory as heap plus overhead explicitly: a 32 GB pod gets executor.memory=20g and memoryOverhead=10g because pandas UDFs and Arrow buffers run outside the heap, and I set spark.executor.pyspark.memory to cap the Python worker. Cores per executor stay at 4 so no more than four partitions are in flight per heap. Any collect() in shared libraries is replaced by write to a staging table that Airflow’s next task reads, and spark.driver.maxResultSize is set to 2 GB as a circuit breaker rather than 0 (unlimited).
Test. Before production, I run the job on a full-size input in staging with spark.eventLog.enabled and inspect peak execution memory, spill and GC time per task in the Spark History Server. A soak test for the streaming job runs for 48 hours while a Prometheus dashboard tracks executor RSS; a steady upward slope indicates a leak (usually state or an unclosed native library) rather than a sizing issue.
Troubleshoot. With exit code 137 and no heap error, I check the Kubernetes pod events (kubectl describe pod) and raise overhead; with “Java heap space” I open the failing stage, find the task with outlier input or shuffle read, and look for skew or a collect_list over a hot key. For the driver, a heap dump (-XX:+HeapDumpOnOutOfMemoryError via spark.driver.extraJavaOptions) opened in Eclipse MAT shows whether Row arrays (a collect) or TaskSetManager objects (too many partitions) dominate. GC overhead limit errors with high “GC time” in the UI mean the heap is full of cached blocks; reducing cache or switching to serialised storage levels helps.
The consideration is that simply doubling executor.memory masks skew for a while and halves cluster capacity; sizing should follow the diagnosis.
31Explain Kafka brokers topics partitions in the context of Apache Spark / Kafka / Airflow.
A Kafka cluster is a set of brokers (servers) that store and serve an append-only, ordered, replicated log. A topic is a named stream of records, and it is split into partitions, each an independent ordered log whose records are addressed by a monotonically increasing offset. Partitions are the unit of parallelism and placement: each partition lives on a subset of brokers (its replicas), with one broker acting as leader for reads and writes and the others following. Producers choose a partition by hashing the record key (same key always lands in the same partition) or round-robin/sticky when there is no key; consumers in a group each own a subset of partitions.
Since Kafka 3.3 cluster metadata is managed by KRaft (a Raft quorum of controller nodes) instead of ZooKeeper, and Kafka 4.0 removed ZooKeeper support entirely, so a 4.x cluster is brokers plus controllers (which can be the same processes in combined mode).
The diagram shows a topic with three partitions spread across three brokers, each with a leader and one follower.
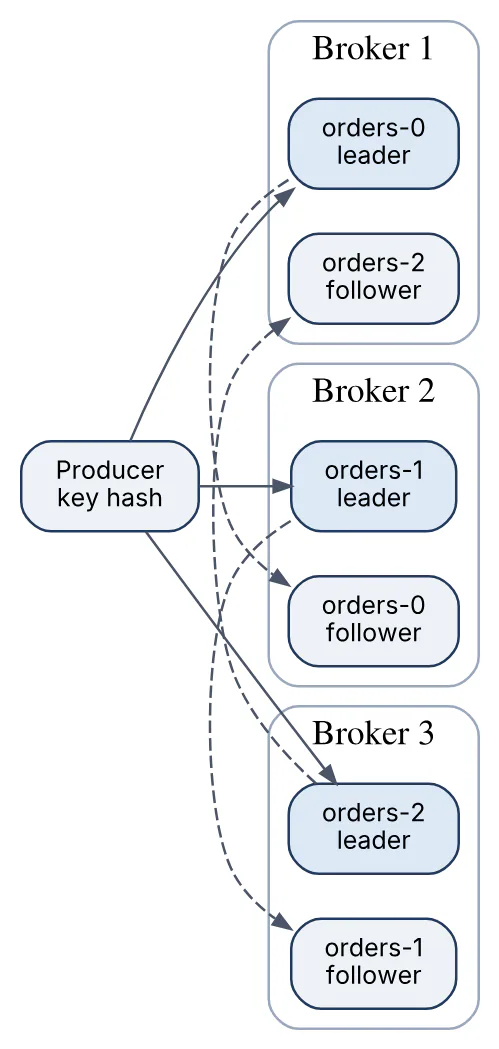
Partition count is a sizing decision made at topic creation: it caps consumer parallelism (more consumers than partitions sit idle), and it can be increased later but never decreased, with increases breaking key-to-partition stability for existing keys.
32In a real project using Apache Spark / Kafka / Airflow, how would you apply, test, or troubleshoot Kafka brokers topics partitions?
Apply. For an order-events topic feeding both a Spark Structured Streaming job and several microservices, I size partitions from the target consumer throughput, not from the producer: at 50 MB/s aggregate and roughly 10 MB/s per consumer instance, 12 partitions gives headroom to scale consumers to 12 and lets Spark run 12 parallel tasks per micro-batch. The key is order_id so all events for an order stay ordered. Topics are created by a Terraform module (or the Airflow deployment DAG calling AdminClient.create_topics) with explicit partitions, replication.factor=3 and min.insync.replicas=2, never by auto-creation, which I disable on the brokers.
Test. kafka-topics.sh --describe in a post-deploy check verifies partition count, replication and that leaders are spread across brokers rather than piled on one. A load test with kafka-producer-perf-test.sh at 1.5 times expected rate, while the Spark consumer runs, confirms per-partition lag stays flat. I also test the broker-loss case by stopping one broker in staging and confirming leadership moves within seconds and producers continue.
Troubleshoot. One partition with far more messages than others means a key with hot values (null keys hashed identically in older clients, or a dominant customer); fixing the producer key or adding a secondary key component resolves it. “Not enough replicas” errors on the producer indicate min.insync.replicas cannot be met because a broker is down or lagging; kafka-topics.sh --describe --under-replicated-partitions shows which. Uneven broker disk use after adding brokers needs a partition reassignment (kafka-reassign-partitions.sh or Cruise Control) because existing partitions do not move automatically.
The consideration is that adding partitions later silently changes key routing, so consumers relying on per-key ordering see a one-time ordering break across the old and new partition.
33Explain Kafka producer acknowledgments in the context of Apache Spark / Kafka / Airflow.
The acks producer setting defines when the broker tells the producer a write succeeded, and therefore how much durability each send buys.
acks | Broker responds when | Durability | Latency |
|---|---|---|---|
0 | Immediately, without writing | None; losses invisible | Lowest |
1 | Leader has written to its log | Lost if leader fails before replicating | Low |
all (-1) | All in-sync replicas have written | Survives leader loss, bounded by ISR | Highest |
acks=all only guarantees as much as the ISR contains, so it is paired with the topic setting | |||
min.insync.replicas | (commonly 2 with replication factor 3): if fewer than that many replicas are in |
sync, the broker rejects the write with NotEnoughReplicasException rather than accepting it with weakened durability. Since Kafka 3.0 the producer defaults are acks=all and enable.idempotence=true, which also sets retries to effectively infinite and max.in.flight.requests.per.connection to 5 while preserving ordering.
producer = KafkaProducer(
    bootstrap_servers="b1:9092",
    acks="all", enable_idempotence=True,
    linger_ms=20, batch_size=65536, compression_type="lz4",
    delivery_timeout_ms=120000)
future = producer.send("orders", key=b"o-123", value=payload)
meta = future.get(timeout=30)   # raises on NotEnoughReplicas / timeout
The example shows the durable configuration; linger.ms and batch.size recover throughput lost to waiting on acknowledgements. Acknowledgement is about the broker-side write only; a successful ack says nothing about any consumer having read the record.
34In a real project using Apache Spark / Kafka / Airflow, how would you apply, test, or troubleshoot Kafka producer acknowledgments?
Apply. In a payments service every event is business-critical, so producers run acks=all, idempotence on, min.insync.replicas=2 on the topic, and delivery.timeout.ms of two minutes so a transient broker failover is absorbed by retries rather than surfacing to the request path. A separate metrics topic that tolerates loss uses acks=1 and larger batches, which roughly halves producer-side latency. The Spark Structured Streaming Kafka sink inherits producer properties via kafka.acks options, so the same durable settings are applied there, and Airflow’s ProduceToTopicOperator (Kafka provider) gets them through its connection’s extra config.
Test. A chaos test in staging kills the leader broker for a partition during a sustained kafka-producer-perf-test.sh run and then compares the count of successful send callbacks with the consumer-side count; with acks=all they must match exactly, and the test asserts it. I also measure p99 send latency under acks=1 versus all to document the cost of the choice.
Troubleshoot. NotEnoughReplicasException bursts correlate with UnderReplicatedPartitions on the broker dashboard; the root cause is usually a broker whose disk or network is saturated and falling out of the ISR. TimeoutException: Expiring N records with no broker errors means the local buffer filled because brokers acknowledged slower than the application produced; raising buffer.memory, increasing linger.ms for better batching or adding partitions fixes it. Duplicate records with acks=all but idempotence disabled (legacy clients) come from retries after a lost acknowledgement, and turning idempotence on removes them.
The consideration is that acks=all with min.insync.replicas=1 gives a false sense of durability: a single leader write satisfies it.
35Explain Kafka consumer groups offsets in the context of Apache Spark / Kafka / Airflow.
A consumer group is a set of consumers sharing a group.id that together read a topic, with each partition assigned to exactly one consumer in the group at a time. Scaling the group out moves partitions to the new members; different groups reading the same topic each get every record, which is how one topic feeds both a Spark job and a search indexer independently.
The diagram shows one topic with three partitions read by two independent groups, each partition owned by a single member per group.
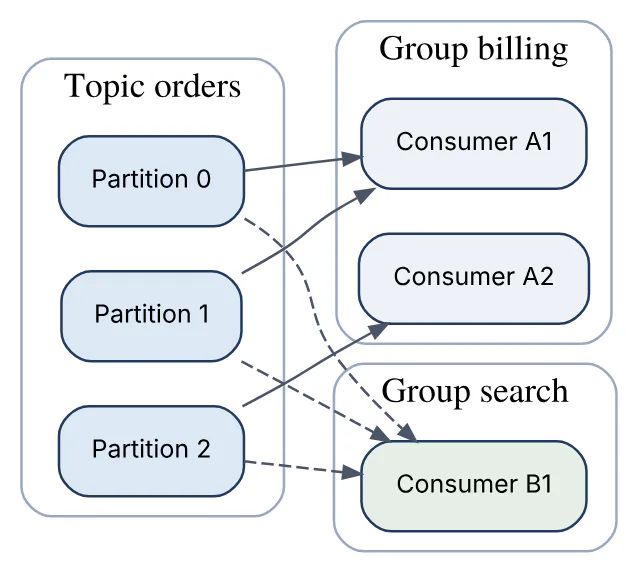
An offset is a consumer’s position in a partition. Committed offsets are stored by Kafka in the internal __consumer_offsets topic, keyed by group, topic and partition. A consumer commits either automatically (enable.auto.commit=true, every auto.commit.interval.ms, default 5 s) or explicitly with commitSync / commitAsync after processing. On restart or after a rebalance the consumer resumes from the committed offset; if none exists, auto.offset.reset decides between earliest and latest. Lag is the difference between the partition’s latest offset and the group’s committed offset.
consumer = KafkaConsumer("orders", group_id="billing",
                         enable_auto_commit=False, auto_offset_reset="earliest")
for batch in consumer:                      # one record at a time
    process(batch.value)
    consumer.commit()                        # commit after work is done
Committing after processing yields at-least-once delivery (a crash between processing and commit replays the record); committing before processing yields at-most-once.
Spark Structured Streaming does not use Kafka’s group commit: it stores offsets in its own checkpoint and uses a random group.id prefix, so lag for a Spark job is not visible in kafka-consumer-groups.sh unless the job also reports it. Airflow’s Kafka provider sensors (AwaitMessageSensor) do use a normal consumer group.
36In a real project using Apache Spark / Kafka / Airflow, how would you apply, test, or troubleshoot Kafka consumer groups offsets?
Apply. For an invoicing consumer in Java I disable auto-commit and commit synchronously once per polled batch after the database transaction for that batch has committed, giving at-least-once with a tight replay window. The consumer is idempotent by writing the record offset alongside the invoice row and ignoring already-seen offsets. Replays of history are an operational procedure: Airflow runs a task that stops the deployment, calls kafka-consumer-groups.sh --reset-offsets --to-datetime 2026-11-01T00:00:00Z --execute, and restarts, rather than someone doing it by hand. For the Spark job, the offset “group” is the checkpoint directory, and we export its committed offsets to a lag metric every batch.
Test. An integration test with Testcontainers produces 1,000 records, kills the consumer after 500 processed and uncommitted, restarts it and asserts that the sink has 1,000 rows with no gaps, proving the commit placement. Another test asserts the consumer with auto.offset.reset=latest sees nothing from before it started, which is the behaviour we want for a new side-car group and do not want for the billing group.
Troubleshoot. Records processed twice after a deploy indicate commits happening less often than processing (auto-commit interval or commit-per-batch with a large batch), so I shrink the batch or commit more granularly. A consumer group that is “rebalancing” forever shows up in kafka-consumer-groups.sh --describe with no assigned members; the usual cause is max.poll.interval.ms exceeded by slow processing. Offsets resetting to earliest unexpectedly mean the group’s committed offsets expired (offsets.retention.minutes, default 7 days) while the consumer was down.
The consideration is that offset commits are per group, so renaming the group.id in a deploy silently starts the application from auto.offset.reset.
37Explain Kafka replication and ISR in the context of Apache Spark / Kafka / Airflow.
Each partition is replicated to replication.factor brokers: one leader serves all produces and, by default, consumes, and the followers fetch from the leader to stay current. The in-sync replica set (ISR) is the subset of replicas that are fully caught up, meaning they have fetched within replica.lag.time.max.ms (default 30 s) and have the leader’s latest offsets. The high watermark is the highest offset replicated to every member of the ISR; consumers can read only up to it, so a record that is acknowledged with acks=all is already durable on all ISR members when it becomes visible.
When a leader fails, the controller elects a new leader from the ISR, which guarantees no acknowledged record is lost. If the ISR shrinks to the leader alone and it then dies, the only options are waiting or unclean leader election (unclean.leader.election.enable, default false) that promotes a lagging replica and loses data. min.insync.replicas sets the floor below which the leader refuses acks=all writes, trading availability for durability.
The diagram shows a partition with three replicas and the ISR after one follower falls behind.
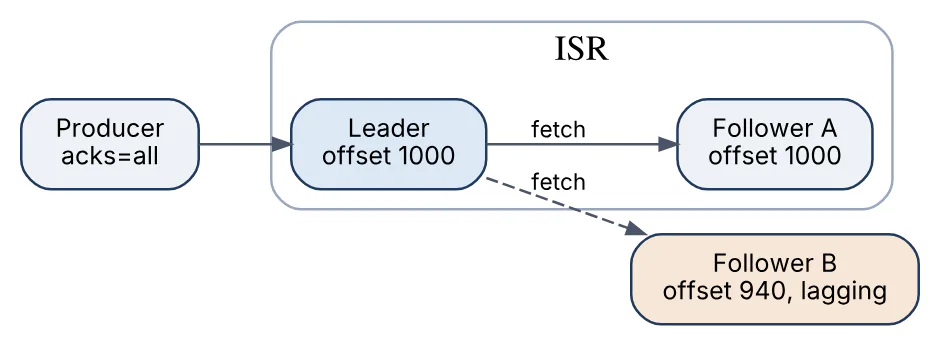
Since Kafka 2.4 consumers may fetch from the closest replica (rack-aware) rather than the leader, which reduces cross-zone traffic without changing the durability model.
38In a real project using Apache Spark / Kafka / Airflow, how would you apply, test, or troubleshoot Kafka replication and ISR?
Apply. A three-availability-zone cluster runs brokers with broker.rack set per zone, replication.factor=3, min.insync.replicas=2 and unclean.leader.election.enable=false for all business topics, so a zone outage leaves every partition writable and no acknowledged data is ever lost. Spark Structured Streaming consumers and the Airflow sensor set client.rack so they read from the follower in their own zone, which cut inter-zone egress noticeably in the cloud. Topics used purely for ephemeral metrics run replication factor 2 and min.insync.replicas=1 to save disk.
Test. In staging I stop one broker while a producer at production rate runs with acks=all and verify three things: UnderReplicatedPartitions rises and then returns to zero after the broker rejoins, no producer errors occur (because ISR stayed at 2), and consumer-side counts match producer counts. A second test stops two brokers and confirms producers receive NotEnoughReplicas rather than silently writing to a lone leader.
Troubleshoot. UnderReplicatedPartitions > 0 for more than a few minutes means a follower cannot keep up; I check that broker’s disk I/O (iostat), network saturation, and replica.fetch.max.bytes versus message sizes, and look for a long GC pause in its logs. Persistent ISR shrink and expand cycles (“flapping”) point to replica.lag.time.max.ms being too tight for a busy follower or an overloaded broker. After a cluster-wide incident, kafka-leader-election.sh --election-type preferred restores leader balance so one broker is not serving all leaders.
The consideration is that replication protects against broker loss, not against bugs or bad producers; it is not a backup, which is why I also use MirrorMaker 2 or tiered storage for retention beyond the cluster.
39Explain Kafka retention versus compaction in the context of Apache Spark / Kafka / Airflow.
Both are cleanup policies that decide which records a topic keeps, set per topic with cleanup.policy.
Retention (cleanup.policy=delete, the default) deletes whole log segments once they are older than retention.ms (default 7 days) or the partition exceeds retention.bytes. Every record is kept until then regardless of key, which suits event streams such as orders, clicks and logs where consumers need the full history for a window of time and then it can go.
Compaction (cleanup.policy=compact) keeps at least the latest record for every key indefinitely and removes older records with the same key; a record with a null value (a tombstone) marks the key for deletion after delete.retention.ms. The topic becomes a changelog that can rebuild the current state of every key, which is how Kafka Streams state stores, Kafka Connect’s offset and config topics, __consumer_offsets, and CDC snapshot topics work.
| Aspect | Retention ( | delete | ) | Compaction ( | compact | ) |
|---|---|---|---|---|---|---|
| Keeps | Everything for a time or size | Latest value per key | ||||
| Requires key | No | Yes | ||||
| Typical data | Events, logs, metrics | Entity state, lookup tables | ||||
| Consumer from start | Replays history window | Rebuilds current state |
Compaction runs in the background on closed segments only (the active segment is never compacted), so a topic temporarily contains duplicates; min.cleanable.dirty.ratio and segment.ms control how eagerly it runs. The two can be combined (compact,delete) to keep the latest per key but drop keys not updated for a long time. For Spark, a compacted topic read from earliest gives a current snapshot table, while a retained topic gives a time-bounded event history.
40In a real project using Apache Spark / Kafka / Airflow, how would you apply, test, or troubleshoot Kafka retention versus compaction?
Apply. In a retail platform the orders event topic uses delete with 14 days of retention so that any Spark backfill run from Airflow can reprocess two weeks; beyond that, the events live in the data lake as Parquet. The product-catalog topic, fed by Debezium CDC from the product database, is compacted and keyed by product_id, so a new Spark streaming job or a microservice can read from earliest and hold the complete current catalog without a database call. Deletes in the source become tombstones, and delete.retention.ms is 24 hours so slow consumers still see them. Spark reads the compacted topic as a static DataFrame per micro-batch for enrichment.
Test. For the retained topic I set retention.ms short in staging, produce, wait, and verify with kafka-get-offsets.sh --time -2 that the earliest offset advanced. For compaction I produce three versions of the same key plus a tombstone, force segment roll with small segment.bytes, wait for the log cleaner and assert a fresh consumer sees only the latest value and that the deleted key disappears. The Spark side gets a test that rebuilding the catalog from the topic matches a direct database snapshot.
Troubleshoot. A Spark job failing with “offsets out of range” after an outage means retention deleted data the checkpoint still referenced; the job needs failOnDataLoss=false or longer retention. A compacted topic that keeps growing usually has the log cleaner stopped (check log-cleaner.log for an exception, often a record larger than log.cleaner.dedupe.buffer.size can handle) or records without keys. A consumer missing deletes means it read after delete.retention.ms expired.
The consideration is that compaction is not a full history: audit requirements need a retained topic or the data lake, not the compacted one.
41Explain Kafka delivery guarantees in the context of Apache Spark / Kafka / Airflow.
Kafka can provide three delivery semantics, and the one you actually get is determined jointly by the producer configuration, the consumer’s commit discipline and the sink’s idempotence.
- At-most-once: records may be lost but never duplicated. On the producer side,
acks=0or no retries; on the consumer side, committing offsets before processing. Acceptable for metrics or sampling. - At-least-once: nothing is lost, but duplicates can occur. Producer with
acks=alland retries; consumer committing after processing. A crash between processing and commit replays the record. This is the default operating point for most pipelines and relies on downstream idempotence (upserts keyed on a business ID) to be correct. - Exactly-once: each record’s effect appears once. Within Kafka this is built from the idempotent producer (deduplication of retried batches per partition using producer ID and sequence numbers) and transactions that atomically write output records and commit consumer offsets. Across to external systems it requires a transactional or idempotent sink.
The guarantee is end-to-end only if every hop holds: a producer with acks=all feeding a consumer that auto-commits every five seconds before finishing its work is at-most-once at the consumer, whatever the producer did. In Spark Structured Streaming, replayable Kafka offsets plus the checkpoint plus an idempotent sink give exactly-once results in Delta or Iceberg, but the Kafka sink in Spark is at-least-once because Spark does not use Kafka transactions. Airflow adds another layer: a retried Airflow task that re-runs a producing job will re-send unless the job itself is idempotent.
The question to ask of any pipeline is “what happens on a retry at each stage”, not “is Kafka exactly-once”.
42In a real project using Apache Spark / Kafka / Airflow, how would you apply, test, or troubleshoot Kafka delivery guarantees?
Apply. In an order-to-fulfilment pipeline the producer side runs at-least-once with idempotence (acks=all), and every downstream consumer is designed to be idempotent instead of chasing exactly-once everywhere: the warehouse service upserts by order_id and version, the Spark job writes to Delta with MERGE on order_id within foreachBatch, and the notification service records sent message IDs in Redis with a TTL so a replayed event does not email twice. The Airflow DAG that publishes daily price updates to Kafka writes a run_id into each record so a retried task produces records that consumers recognise as duplicates.
Test. Duplicate injection is the main test: a test harness publishes each record twice with the same key and payload and asserts the sink state is identical to the single-publish run. Crash tests kill the consumer between processing and commit (a fault-injection flag after N records) and confirm no loss. For loss detection I run a producer with sequence-numbered payloads and a consumer that asserts the sequence is gap-free per partition.
Troubleshoot. Missing records with no errors nearly always trace to auto.offset.reset=latest on a group whose offsets expired, or to a consumer committing before processing and then crashing. Duplicates after a rolling restart point to commit intervals longer than processing time; I move to commit-per-batch. A Spark sink showing duplicates despite foreachBatch usually means the MERGE key did not cover the actual uniqueness (e.g. missing a source_partition or event_version).
The consideration is that idempotent consumers are cheaper and more robust than transactional pipelines, and most “we need exactly-once” requirements are satisfied by at-least-once plus a good idempotency key.
43Explain Kafka exactly-once semantics in the context of Apache Spark / Kafka / Airflow.
Exactly-once semantics (EOS) in Kafka means a consume-transform-produce step reads records from input topics, writes results to output topics and commits its input offsets as one atomic unit, so a retry after a crash neither loses the step nor applies it twice. Two mechanisms combine to deliver it:
- Idempotent producer (
enable.idempotence=true, default since 3.0): the broker assigns a producer ID and the producer attaches a per-partition sequence number to every batch, so a retried batch after a lost acknowledgement is detected and discarded. This removes producer-side duplicates but is limited to one producer session and one partition. - Transactions (
transactional.idset,initTransactions(),beginTransaction(),send(),sendOffsetsToTransaction(),commitTransaction()): records in the transaction, possibly across many partitions, plus the consumer offset commit are written with transaction markers coordinated by a transaction coordinator broker. Consumers withisolation.level=read_committedsee only committed records; aborted ones are skipped.
The diagram shows a consume-transform-produce step whose output and offset commit are one transaction.

producer.initTransactions();
while (true) {
  ConsumerRecords<String, String> recs = consumer.poll(Duration.ofMillis(200));
  producer.beginTransaction();
  for (var r : recs) producer.send(new ProducerRecord<>("out", r.key(), enrich(r)));
  producer.sendOffsetsToTransaction(offsetsOf(recs), consumer.groupMetadata());
  producer.commitTransaction();          // offsets and output visible together
}
The transactional.id fences zombies: when a new instance with the same ID starts, the old one’s producer epoch is invalidated so a hung instance cannot commit late. Kafka Streams enables all of this with processing.guarantee=exactly_once_v2.
The guarantee stops at Kafka’s edge. Side effects such as a REST call or a database write inside the loop are not covered; those need an idempotent or transactional sink of their own, which is exactly what Spark’s checkpoint-plus- MERGE approach supplies on the lake side.
44In a real project using Apache Spark / Kafka / Airflow, how would you apply, test, or troubleshoot Kafka exactly-once semantics?
Apply. For a ledger service that reads payments and emits ledger-entries, I run a Kafka Streams topology with processing.guarantee=exactly_once_v2, which handles transactions, offset commits and state-store changelogs atomically. For a custom Java consumer that also writes to PostgreSQL, I do not use Kafka transactions at all; I use the database: the offset for each partition is stored in the same table transaction as the business rows, and on startup the consumer seeks to the stored offsets. The Spark path reads payments with isolation.level=read_committed (via kafka.isolation.level) so it never sees aborted transactional writes, and writes to Iceberg with an idempotent MERGE.
Test. A test with Testcontainers runs two instances with the same transactional.id, suspends the first mid-transaction, lets the second start, resumes the first and asserts it receives ProducerFencedException and that the output topic (read with read_committed) contains exactly one copy of each input. A throughput test compares commit.interval.ms values because every commit is a transaction with coordinator round-trips; 100 ms versus 1 s changes throughput substantially.
Troubleshoot. InvalidProducerEpochException or ProducerFencedException in a single-instance deployment usually means a transaction exceeded transaction.timeout.ms (default 60 s) during a slow batch and the coordinator aborted it; shrinking batch size or raising the timeout (within transaction.max.timeout.ms on the broker) fixes it. Consumers “stuck” at an offset while new data flows see an open transaction holding the last stable offset back, typically a hung producer that never committed; its transaction times out and the LSO advances. Duplicates in a downstream database despite EOS mean the database write was outside the transaction boundary.
The consideration is that EOS costs latency and throughput (transaction markers, coordinator calls, read_committed buffering), so it should be scoped to the stages that need it.
45Explain Kafka schemas and compatibility in the context of Apache Spark / Kafka / Airflow.
Kafka brokers store bytes and know nothing about their structure, so producers and consumers must agree on a serialisation format and on how that format may change. A schema registry (Confluent Schema Registry, Apicurio, Karapace, AWS Glue Schema Registry) stores versioned schemas for Avro, Protobuf or JSON Schema under a subject (usually <topic>-value), and serialisers prefix each message with a schema ID so consumers can fetch the exact schema that wrote the record.
Compatibility mode on a subject decides which schema evolutions the registry accepts:
| Mode New schema can read data written by | Safe change examples |
|---|---|
BACKWARD Previous schema (default) | Delete fields, add optional fields with default |
FORWARD Old consumers read new data | Add fields, delete optional fields |
FULL Both directions | Add/remove optional fields with defaults only |
NONE No check | Breaking changes, requires coordinated deploy |
Backward compatibility is the usual choice when consumers are upgraded before producers; forward when producers move first. The *_TRANSITIVE variants check against every earlier version, not just the latest.
For Spark, the schema matters twice: from_avro with a registry (Databricks’ from_avro(..., schemaRegistryAddress) or the open-source ABRiS library) decodes records in Structured Streaming, and the resulting DataFrame schema must match the sink table, so an incompatible evolution breaks the stream or the Delta MERGE. Airflow DAGs that produce records use the same serialisers from the Kafka provider’s hooks. A registry does not protect against semantic changes (a field whose meaning changes) and does not validate records that bypass the registry-aware serialiser.
46In a real project using Apache Spark / Kafka / Airflow, how would you apply, test, or troubleshoot Kafka schemas and compatibility?
Apply. Order events are Avro with a registry subject per topic in BACKWARD_TRANSITIVE mode, and the schemas live in a Git repository as the source of truth. A CI pipeline registers them, so nobody creates a schema from application code at runtime (auto.register.schemas=false in all producers, use.latest.version=true where appropriate). Field additions always carry defaults; renames are done as add-then-remove over two releases. The Spark enrichment job resolves the writer schema by the message’s schema ID, then selects an explicit list of columns, so a new optional field appears as a column only when we choose to add it to the sink.
Test. The CI step calls the registry’s compatibility endpoint (POST /compatibility/subjects/orders-value/versions/latest) for every changed .avsc and fails the build on is_compatible=false. Consumer contract tests deserialise fixture records produced with each of the last three schema versions and assert the business fields still map. For Spark, a test reads sample records of each version through the streaming parser and asserts the DataFrame schema equals the sink table schema.
Troubleshoot. SerializationException: Error retrieving Avro schema for id 143 means the consumer cannot reach the registry or is pointed at the wrong one (a staging consumer reading production records). Schema being registered is incompatible with an earlier schema at deploy time is the registry doing its job; the fix is in the schema, not the mode. A Spark stream failing with AnalysisException about a missing column after a producer release indicates a field was removed; adding a default or pinning the reader schema version resolves it.
The consideration is that NONE compatibility set “temporarily” tends to stay forever, so I treat it as requiring a documented coordinated deploy with a rollback plan.
47Explain Kafka Connect and CDC in the context of Apache Spark / Kafka / Airflow.
Kafka Connect is Kafka’s framework for moving data between Kafka and external systems without writing producer or consumer code. Connectors are configured with JSON and run inside Connect workers; source connectors pull from a system into topics and sink connectors push from topics to a system. Work is split into tasks, the framework handles offsets (in the connect-offsets topic), retries, schema conversion (Converters such as Avro or JSON) and lightweight single message transforms. Distributed mode runs workers as a group and rebalances connectors and tasks across them via a REST API on port 8083.
Change data capture (CDC) is the source pattern where a connector reads a database’s transaction log (PostgreSQL logical replication slot, MySQL binlog, SQL Server CDC tables, Oracle LogMiner) and emits every insert, update and delete as an event, typically one topic per table. Debezium is the standard open-source implementation. Each event carries before and after images, the operation type and source metadata, and the connector first takes a consistent snapshot of existing rows before streaming the log.
The diagram shows a typical CDC flow into the lake.

CDC replaces fragile “select where updated_at > last run” batch extraction, captures deletes, and gives near-real-time replication. Its costs are operating Connect workers, managing replication slots that hold WAL if the connector stops, and handling source schema changes.
48In a real project using Apache Spark / Kafka / Airflow, how would you apply, test, or troubleshoot Kafka Connect and CDC?
Apply. For replicating an orders database to the lakehouse I run Debezium on a three-worker Connect cluster, one connector per database with table.include.list restricted to the tables needed, Avro converters backed by the schema registry, and the ExtractNewRecordState transform so events carry a flat after image plus __op and __deleted fields. A Spark Structured Streaming job applies the events to Delta with MERGE ordered by the source LSN within each micro-batch, so out-of-order updates for the same key resolve correctly. Airflow owns the control plane: a DAG deploys connector configs idempotently through the REST API (PUT /connectors/{name}/config) and a sensor checks connector and task status before downstream jobs run.
Test. An integration test with Testcontainers spins up PostgreSQL, Kafka and Connect, posts the connector, inserts, updates and deletes a row and asserts the three events on the topic with the right op codes. Snapshot behaviour is tested with pre-existing rows. For the Spark apply step, a test feeds events with deliberately shuffled order within a batch and asserts the final row matches the highest LSN.
Troubleshoot. A connector in FAILED state is diagnosed via GET /connectors/x/status and the worker log; common causes are a schema change the converter rejects, a dropped replication slot, or a max.request.size exceeded by a large row. Rapidly growing PostgreSQL disk means the replication slot is retained while the connector is down; restarting it or dropping the slot (accepting a re-snapshot) resolves it. Lag growing on one table’s topic points to a hot table needing its own connector or increased max.batch.size.
The consideration is that CDC exposes the source’s physical schema to consumers, so a layer that maps it to a stable contract protects downstream jobs from database refactors.
49Explain Kafka dead-letter handling in the context of Apache Spark / Kafka / Airflow.
A dead-letter topic (DLT, or DLQ) is where a consumer sends records it cannot process, so that one bad record does not stop the partition or get silently dropped. Because Kafka consumers process a partition in offset order, a record that always fails (a malformed payload, a missing foreign key, an unknown schema version) would otherwise either block all later records in that partition (a “poison pill”) or force the consumer to skip it and lose the data. Writing the original record, with headers that capture the exception, the source topic, partition and offset, and a retry count, to a <topic>.DLT keeps the main stream flowing while preserving the failure for inspection and replay.
Common building blocks:
- Kafka Connect sink connectors:
errors.tolerance=all,errors.deadletterqueue.topic.name,errors.deadletterqueue.context.headers.enable=trueroute conversion and transform failures automatically. - Spring Kafka:
DefaultErrorHandlerwith aDeadLetterPublishingRecovererafter N retries with backoff; Kafka Streams: aDeserializationExceptionHandleror branching invalid records to a side topic. - Retry topics: a tiered pattern (
orders.retry.1m,orders.retry.10m) separates transient failures (downstream outage) from permanent ones before anything reaches the DLT. - Replay: an operator fixes the cause and a tool (or an Airflow task) re-publishes DLT records to the original topic.
Spark Structured Streaming does not have a built-in dead-letter sink; the equivalent is parsing with from_json and routing rows where the parsed struct is null to a quarantine table or topic in the same foreachBatch, with the raw bytes and error context preserved. The DLT must be monitored; an unwatched DLT is a quieter way of losing data.
50In a real project using Apache Spark / Kafka / Airflow, how would you apply, test, or troubleshoot Kafka dead-letter handling?
Apply. In the order-ingestion Spark job, each micro-batch parses raw Kafka bytes against the registry schema; rows that fail parsing or fail business validation (negative quantity, unknown currency) are written to a orders_quarantine Delta table with the raw value, Kafka topic, partition, offset, timestamp and an error_reason column, and the remainder proceed. For the Java services, Spring Kafka retries transient exceptions three times with exponential backoff and publishes to orders.DLT with exception headers for non-retryable ones. An Airflow DAG runs hourly: it counts new DLT and quarantine records, raises an alert above a threshold, and offers a parameterised “replay” DAG that re-publishes selected records after a fix.
Test. Unit tests feed a poison record (invalid JSON, wrong schema ID) followed by valid records and assert that the valid ones are processed, the poison one lands in the DLT with the expected headers, and offsets advance past it. For the retry path, a test makes the downstream dependency fail twice then succeed and asserts no DLT entry is created. A replay test publishes a DLT record back and asserts the sink ends in the correct state once.
Troubleshoot. A consumer stuck re-reading the same offset with repeated exceptions means error handling is not in place for that exception type and the record is a poison pill; I add it to the non-retryable set. A rapidly filling DLT after a deploy almost always means a schema or contract change, and the fix is upstream, followed by a replay. DLT records with no context headers are useless; I treat missing headers as a bug in the error handler.
The consideration is that DLT records may contain personal data under a different retention regime than the main topic, so the DLT needs its own retention and access controls.
51Explain Kafka ordering guarantees in the context of Apache Spark / Kafka / Airflow.
Kafka guarantees order within a partition and nowhere else. Records appended to one partition are stored and delivered to a consumer in offset order; records in different partitions of the same topic have no defined relative order. So the design question is always “which records must be ordered relative to each other?”, and the answer becomes the partition key: all events for one order_id or one account_id share a key and therefore a partition, so they are seen in the order produced.
Three things can still break the per-key order:
- Producer retries without idempotence: with
max.in.flight.requests.per.connection > 1andenable.idempotence=false, a failed batch retried after a later batch succeeded arrives out of order. The idempotent producer (default since 3.0) preserves order with up to five in-flight requests. - Changing the partition count: the hash mapping changes, so old and new events for the same key may live in different partitions.
- Consumer-side parallelism: a consumer that hands records to a thread pool, or a Spark job that repartitions by something other than the key, reorders them; Spark also provides no ordering across tasks within a micro-batch unless you sort by offset within a key.
Multiple producers writing the same key from different services also race, because order is defined by arrival at the leader, not by event time. Where total ordering across keys is required, a single partition is the only option, and that caps throughput to one consumer. For Spark consumers, ordering is reconstructed logically (window by event time, deduplicate by version) rather than relied on physically.
52In a real project using Apache Spark / Kafka / Airflow, how would you apply, test, or troubleshoot Kafka ordering guarantees?
Apply. For an account-balance stream I key by account_id, keep the idempotent producer defaults, and make the single producer per account (the account service) the only writer of that key. Downstream, the Spark job processes each micro-batch by sorting events within account_id by Kafka offset before applying them with MERGE, so Spark’s internal parallelism never reorders a key’s events relative to each other. Every event also carries a monotonic version from the source database, and the sink rejects a MERGE where the incoming version is lower than the stored one, which protects against any residual reordering. Partition count for the topic was fixed at 48 up front with headroom, specifically so it never has to change.
Test. A property-style test produces interleaved sequences for 1,000 keys, each key’s events numbered, and a consumer asserts that for every key the sequence numbers arrive strictly increasing. The same test runs with a broker restart in the middle to exercise producer retries. For the Spark path a test feeds a micro-batch with a key’s events in reversed offset order and asserts the final sink state matches the highest offset.
Troubleshoot. Balance mismatches that correlate with partition-count changes or with a second producer deploy are the typical reorder incidents. I compare the offending key’s events across partitions with kafka-console-consumer.sh --property print.partition=true and check producer configs for enable.idempotence=false left over from older clients. Reorders in a Java consumer that uses an executor per record are a consumer bug: process per-partition sequentially or hash to per-key worker queues.
The consideration is that ordering and parallelism trade off directly; fine-grained keys spread load but a key that must see a cross-key order needs a coarser key.
53Explain Kafka rebalancing in the context of Apache Spark / Kafka / Airflow.
A rebalance is the process by which partitions of a topic are reassigned among the members of a consumer group when the membership or the subscription changes: a consumer joins, leaves, crashes, fails to poll within max.poll.interval.ms, misses heartbeats for session.timeout.ms, or the topic gains partitions. The group coordinator (a broker) drives it.
With the classic protocol, eager rebalancing revokes all partitions from everyone, members rejoin, and the group leader (one consumer) computes a fresh assignment, so the whole group stops consuming during the rebalance. The cooperative sticky assignor (CooperativeStickyAssignor, Kafka 2.4+)
does this incrementally in two phases, revoking only partitions that must move, so unaffected partitions keep flowing. Static membership (group.instance.id) lets a restarted consumer rejoin with the same identity inside session.timeout.ms without triggering a rebalance at all, which is important for rolling deploys.
Kafka 4.0 made the next-generation consumer rebalance protocol (KIP-848) generally available: the assignment is computed on the broker, members reconcile incrementally, and the client-side group leader and the global synchronisation barrier are gone, which makes rebalances faster and far less disruptive for large groups. Clients select it with group.protocol=consumer.
Spark Structured Streaming is unaffected by consumer-group rebalances because it assigns Kafka partitions to tasks itself and does not join a group for assignment. Airflow’s Kafka sensors and operators are ordinary consumers and participate normally.
Rebalance duration is the gap between a member stopping and the new assignment being usable, and during it offsets are usually not committed, so a rebalance storm produces both lag and duplicates.
54In a real project using Apache Spark / Kafka / Airflow, how would you apply, test, or troubleshoot Kafka rebalancing?
Apply. For a 24-instance Java consumer service on Kubernetes I set group.instance.id to the pod’s stable StatefulSet name for static membership, session.timeout.ms of 45 seconds so a pod restart within that window causes no rebalance, and partition.assignment.strategy=CooperativeStickyAssignor on 3.x clusters (or group.protocol=consumer on 4.x) so scaling events move only the partitions that must move. max.poll.interval.ms is raised to 10 minutes because a batch can call a slow downstream, and max.poll.records is lowered to keep each poll’s work bounded. A ConsumerRebalanceListener commits in-flight offsets on onPartitionsRevoked so the handover is clean.
Test. A staging test scales the deployment from 24 to 30 and back while measuring, via consumer metrics, rebalance-latency-avg, rebalance-total and the time partitions were unassigned; the cooperative protocol should show most partitions never paused. A second test kills a pod and asserts no rebalance occurred within the session timeout. The listener is unit-tested to confirm offsets are committed on revocation.
Troubleshoot. A group that rebalances every few minutes with “Member … sending LeaveGroup request due to consumer poll timeout” in the logs has processing slower than max.poll.interval.ms; shrink max.poll.records or make processing asynchronous with manual pausing. Rebalances on every deploy without static membership are expected; adding group.instance.id fixes them. A rebalance that never finishes with the classic protocol typically has one member stuck in a long poll loop or an incompatible assignor across versions during a mixed deploy.
The consideration is that long session timeouts delay failover for genuinely dead consumers, so static membership trades recovery time for stability.
55Explain Kafka lag troubleshooting in the context of Apache Spark / Kafka / Airflow.
Consumer lag is, per partition, the latest offset in the log minus the consumer group’s committed offset: how many records the consumer has not yet confirmed processing. Lag that is stable is a latency; lag that grows is a capacity or health problem. Troubleshooting is about locating which of the three stages is responsible.
- Measure correctly.
kafka-consumer-groups.sh --describe --group billingshowsCURRENT-OFFSET,LOG-END-OFFSET,LAGand the assignedCONSUMER-IDper partition. Exporters such as Burrow orkafka_exporterfeed Prometheus; for Spark jobs the group commit is absent, so lag must be derived from the checkpoint offsets or from theStreamingQueryListener’slatestOffsetversusendOffset, which Spark 3.x exposes per source. - Is lag on all partitions or some? Uniform lag points to the consumer fleet (too few instances, slow downstream, GC pauses, rebalancing). Lag on one or two partitions points to a hot key, a skewed partition, or a single sick consumer instance.
- Is the consumer processing at all? A
CONSUMER-IDof-means no member holds the partition (group is dead or rebalancing). A member present butCURRENT-OFFSETfrozen means it is stuck inside processing, often waiting on an external call. - Compare rates. Producer
records-per-secondon the topic versus consumerrecords-consumed-rate; if production exceeds consumption, scale consumers up to the partition count or add partitions (with the ordering caveat) and increasefetch.min.bytes/max.poll.recordsfor batching.
Typical remedies are adding instances, making processing asynchronous or batched, fixing the slow dependency, moving consumers to the same region as brokers, and in Spark raising maxOffsetsPerTrigger back off once caught up. Lag that resets to zero suddenly with an offset jump means retention deleted the data the consumer had not reached: lag was converted into loss.
56In a real project using Apache Spark / Kafka / Airflow, how would you apply, test, or troubleshoot Kafka lag troubleshooting?
Apply. Lag is treated as a first-class SLO: kafka_exporter publishes per-group per-partition lag to Prometheus, the Spark job publishes its own lag gauge from a StreamingQueryListener on every batch, and Airflow’s hourly health DAG runs kafka-consumer-groups.sh --describe across critical groups and pushes the output to the log plus a metric. Alerts are on lag in seconds (derived from the timestamp of the last consumed record) rather than records, with two thresholds: a warning at 2 minutes and a page at 10, and a separate “no progress” alert when committed offsets do not move for five minutes while log-end offsets do.
Test. Capacity tests in staging produce at 1.5 times the peak rate for 30 minutes and require lag to stay bounded and drain within 5 minutes of the load stopping. A failure-injection test slows the downstream database by 500 ms per call and confirms the “no progress” alert fires and the dashboard shows lag concentrated on all partitions. For the Spark job, I set maxOffsetsPerTrigger deliberately low and verify the catch-up path after a simulated two-hour outage.
Troubleshoot. In one incident, lag on two of 48 partitions grew while others were fine; --describe showed both on the same consumer pod, whose logs had repeated connection resets to a payment-gateway host. Restarting the pod moved the partitions and cleared the lag, and a connection-pool fix removed the root cause. In another, uniform lag after a release traced to a new synchronous audit-log call; the fix was batching it. For Spark, lag that grew only during compaction windows pointed to shared executors with the Delta OPTIMIZE job, solved by separating node pools.
The consideration is that catching up fast after an outage can itself overload downstream systems, so a rate cap during recovery is often part of the fix.
57Explain Kafka security ACLs in the context of Apache Spark / Kafka / Airflow.
Kafka security has three layers: encryption in transit (TLS listeners), authentication (who the client is: mutual TLS certificates, SASL/SCRAM username and password, SASL/OAUTHBEARER tokens, or SASL/GSSAPI Kerberos), and authorisation, which is where ACLs come in. An access control list entry binds a principal (User:spark-orders) to an operation (Read, Write, Describe, Create, Alter, DescribeConfigs, IdempotentWrite, All) on a resource (a topic, consumer group, cluster, transactional ID or delegation token), optionally restricted by host, with Allow or Deny effect. Resource names can be literal or PREFIXED, so orders-* style grants are possible.
The authorizer is pluggable; the built-in one is StandardAuthorizer under KRaft (the ZooKeeper-based AclAuthorizer disappeared with ZooKeeper in Kafka 4.0). With allow.everyone.if.no.acl.found=false, the secure default, any resource without an ACL is denied, and super.users lists principals exempt from checks.
kafka-acls.sh --bootstrap-server b1:9093 --command-config admin.properties \
  --add --allow-principal User:spark-orders \
  --operation Read --operation Describe --topic orders \
  --group spark-orders-ckpt --resource-pattern-type prefixed
A consumer needs Read on the topic and Read on its group; a producer needs Write and Describe on the topic, plus IdempotentWrite on the cluster (relaxed in 3.x when the principal has topic Write) and Write on its transactional ID for EOS. Spark’s Kafka source uses a randomly prefixed group ID, so the group ACL must be prefixed on spark.kafka.consumer.groupIdPrefix. ACLs do not encrypt or mask data; field-level protection belongs in the application or in the schema layer.
58In a real project using Apache Spark / Kafka / Airflow, how would you apply, test, or troubleshoot Kafka security ACLs?
Apply. Each application gets its own principal (SASL/SCRAM in the Kafka 3.x cluster, migrated to mutual TLS with SPIFFE certificates on the 4.x cluster) and the minimum ACLs it needs, managed as code in Terraform through the AdminClient. The Spark orders job has Read / Describe on the orders topic and Read on groups prefixed spark-orders-, which matches its groupIdPrefix; the Delta writer side needs nothing from Kafka. Airflow’s KafkaProducerHook principal has Write on price-updates only, with credentials pulled from the Airflow connection stored in Vault, never in DAG code. Broker-side allow.everyone.if.no.acl.found is false, and the cluster-level Create right is granted only to the platform principal so topic auto-creation cannot happen from applications.
Test. A permission test suite runs against staging after every ACL change: for each principal it attempts to produce to and consume from each topic and asserts the expected TopicAuthorizationException for everything outside its grant. Authorizer logs are set to INFO in staging (kafka.authorizer.logger) so denied operations are visible during tests. For the Spark job, a smoke run with the new credentials must complete one micro-batch before the deployment proceeds.
Troubleshoot. GroupAuthorizationException on a Spark job that has topic access is almost always the group prefix mismatch between the ACL and groupIdPrefix. TransactionalIdAuthorizationException appears when EOS is enabled without the transactional-ID ACL. Not authorized to access topics: [Topic authorization failed] after a broker upgrade usually means the ACLs were not migrated from the old authorizer during the KRaft migration; kafka-acls.sh --list on the new cluster confirms. Repeated SaslAuthenticationException indicates a rotated password not yet propagated to the connection store.
The consideration is that ACL denials look like the topic does not exist (metadata is filtered for unauthorised principals), which misleads engineers into chasing topic-creation problems.
59Explain Airflow DAG tasks scheduler in the context of Apache Spark / Kafka / Airflow.
In Airflow a DAG is a Python object describing a workflow: a set of tasks with dependencies between them, a schedule, and run-level settings such as start date and catchup. A task is an instance of an operator (or a @task -decorated function) and does one unit of work; the edges (extract >> transform >> load) say only what must finish before what starts. The DAG itself contains no business data; it is the recipe, and each scheduled execution is a DAG run containing one task instance per task.
The scheduler is the daemon that makes it happen: it parses DAG files (via the DAG processor, a separate component by default in Airflow 3), creates DAG runs when a schedule is due, examines task instances whose upstream dependencies are satisfied, queues them and hands them to the executor, which runs them on workers. Task state (queued, running, success, failed, up_for_retry, skipped) lives in the metadata database. Multiple schedulers can run in parallel for high availability (since 2.0). Airflow 3 added the API server and Task SDK: workers no longer talk to the metadata database directly but go through the Task Execution API, which allows remote and multi-language workers.
The diagram shows the control flow for one scheduled run.

Tasks should be idempotent and small enough to retry individually, because the scheduler’s unit of retry and of state is the task, not the DAG.
60In a real project using Apache Spark / Kafka / Airflow, how would you apply, test, or troubleshoot Airflow DAG tasks scheduler?
Apply. A daily lakehouse DAG has a sensor for the source partition, a SparkKubernetesOperator task that submits the Spark job in cluster mode, a data-quality task, and a publish task that swaps a view. Each task is idempotent for its data_interval, uses default_args with retries, and the Spark task is deferrable so it does not occupy a worker slot while the job runs for an hour. DAG files are kept thin: no network calls or heavy imports at module top level, because the DAG processor re-parses them every min_file_process_interval (30 s default), and a slow import there delays every DAG in the deployment. Schedule and resource knobs are set at the DAG level (max_active_runs=1, max_active_tasks) and per pool for the Spark cluster.
Test. A CI step imports every DAG file (DagBag with include_examples=False) and fails on import errors or parse time above two seconds. Unit tests check task IDs and dependencies (dag.get_task("load").upstream_task_ids). airflow dags test <dag_id> 2026-11-05 runs the whole DAG for one logical date locally without the scheduler, which is the fastest end-to-end check; airflow tasks test isolates one task.
Troubleshoot. Tasks stuck in queued with free worker capacity usually mean a pool or parallelism limit is exhausted, or the executor lost the task; the scheduler log and the pool page confirm. A DAG that disappears from the UI has an import error shown on the “Import errors” banner and in the processor log. A DAG that runs late every day has a scheduler loop starved by a heavy DAG file; airflow dags report shows per-file parse times. Zombie tasks (worker died) are detected by the scheduler after scheduler_zombie_task_threshold and retried.
The consideration is that the scheduler’s health depends on cheap DAG parsing, so a DAG file that reads a database at import time can degrade an entire Airflow deployment.
61Explain Airflow operators versus sensors in the context of Apache Spark / Kafka / Airflow.
An operator is a task template that performs an action when it runs: BashOperator, PythonOperator (or a @task function), SparkSubmitOperator, KubernetesPodOperator, SQLExecuteQueryOperator, the Kafka provider’s ProduceToTopicOperator. It starts, does its work, and finishes with success or failure. A sensor is a special operator that waits for a condition to become true before succeeding: a file or partition exists (S3KeySensor), a time has passed, an external task finished (ExternalTaskSensor), a Kafka message matching a predicate arrived (AwaitMessageSensor), or a custom poke() returned true.
| Aspect | Operator | Sensor |
|---|---|---|
| Purpose | Do something | Wait for something |
| Completion | When the action ends | When the condition holds or timeout expires |
| Resource use | Occupies a slot while running | Poke mode occupies a slot; reschedule or deferrable frees it |
| Key parameters | Action-specific | poke_interval, timeout, mode, soft_fail |
Sensors have three execution modes. poke keeps the worker slot and sleeps between checks; reschedule releases the slot and re-queues the task at each interval, suited to waits of minutes to hours; deferrable sensors (deferrable=True, Airflow 2.2+) hand the wait to the triggerer process as an async trigger, consuming no worker slot at all and scaling to thousands of concurrent waits. Many long-running operators also have deferrable versions (for example SparkKubernetesOperator and the EMR operators), blurring the line: they submit the job, defer while it runs, then resume to collect the result.
A sensor should guard a dependency the DAG cannot otherwise express, and its timeout must be set, because the default of seven days turns a missing upstream into a week of silence.
62In a real project using Apache Spark / Kafka / Airflow, how would you apply, test, or troubleshoot Airflow operators versus sensors?
Apply. The daily lakehouse DAG starts with a deferrable S3KeySensor waiting for _SUCCESS under the day’s raw prefix, with timeout=6*3600 and poke_interval=300, so a late upstream delivery neither blocks a worker nor silently waits for a week. The Spark step uses the deferrable SparkKubernetesOperator; while the job runs for ninety minutes, the triggerer polls the driver pod status and the worker slot is free for other DAGs. For an event-driven variant, an AwaitMessageSensor on a Kafka control topic waits for a “partition complete” message from the producing service, which replaces polling S3 entirely. A custom operator wraps the data-quality call so its retry and logging are standardised across DAGs.
Test. Sensors are unit-tested by calling poke(context) with a mocked hook and asserting true/false for present and missing keys. The deferrable path is covered by a test that runs the trigger’s async run() against a mocked API and asserts the TriggerEvent payload. A DAG-level test with airflow dags test and a short timeout verifies the sensor fails cleanly when the key is absent and that soft_fail skips downstream tasks when that is the intended behaviour.
Troubleshoot. Worker slots exhausted by poke -mode sensors show as many running tasks doing nothing and other DAGs queued; switching to reschedule or deferrable fixes it. A deferrable task stuck in deferred means the triggerer is down or its capacity (default_capacity, 1000) is exceeded; the triggerer health check in the UI confirms. A sensor that times out every day at the same hour reveals an upstream SLA problem, not an Airflow one, and the fix is a conversation with that team.
The consideration is that a sensor polling an external API too frequently can be throttled or billed; poke_interval is a cost knob, not just a latency knob.
63Explain Airflow XCom and Variables in the context of Apache Spark / Kafka / Airflow.
XCom (“cross-communication”) is the mechanism for passing small values between tasks within a DAG run. A task pushes a value (explicitly with ti.xcom_push(key, value), or implicitly by returning from a @task function or an operator with do_xcom_push=True), and a downstream task pulls it (ti.xcom_pull(task_ids=...) or by receiving the TaskFlow return value as an argument). XComs are scoped to a DAG ID, task ID, run and map index, stored in the metadata database as JSON, and meant for metadata such as a file path, a row count, a Spark application ID or a date, not for datasets. A custom XCom backend (xcom_backend setting) can offload large payloads to S3 or GCS and store only a reference; Airflow 3 made the object-storage backend part of the common.io provider and removed the pickling option.
Variables are global key-value settings stored in the metadata database (or resolved from a secrets backend), independent of any DAG run: an environment name, a bucket, a feature flag, a Spark image tag. They are read with Variable.get("key") or in templates as {{ var.value.key }} / {{ var.json.key.field }}.
@task
def submit_spark(bucket: str) -> str:
    app_id = launch_spark_job(bucket)
    return app_id                       # pushed as XCom "return_value"

@task
def wait_and_validate(app_id: str):
    ...

wait_and_validate(submit_spark(Variable.get("raw_bucket")))
Variables read at module top level are evaluated every time the DAG file is parsed, which hits the database constantly; reading them inside tasks or via templates avoids that. XComs are for intra-run data flow; Variables are for configuration; neither is a channel for bulk data or secrets.
64In a real project using Apache Spark / Kafka / Airflow, how would you apply, test, or troubleshoot Airflow XCom and Variables?
Apply. In the lakehouse DAG the Spark submission task returns the application ID and the output path as a small dict via XCom; the data-quality task pulls the path, and the publish task pulls the row count to decide whether to swap the view. Anything larger than a few kilobytes, such as the list of partitions processed, is written to S3 and only the key is passed, and an S3 custom XCom backend enforces this when someone forgets. Variables hold environment configuration (env, spark_image_tag, lake_bucket) and are referenced in templates ({{ var.value.lake_bucket }}), never at DAG parse time. Variables are deployed from a versioned JSON file with airflow variables import in the CD pipeline so production values are reviewable.
Test. TaskFlow functions are plain Python, so unit tests call them directly and assert the returned dict shape. DAG tests run with airflow dags test and a mocked Variable set via environment variables (AIRFLOW_VAR_LAKE_BUCKET=test-bucket), which Airflow resolves before the database. A parse-time test asserts that importing the DAG module performs zero database queries, catching any Variable.get at module level.
Troubleshoot. A task failing with KeyError / None on xcom_pull after a retry typically pulled from a task that was skipped or from the wrong task_ids; the XCom tab on the run shows exactly which keys exist. A metadata database growing fast with large xcom rows means someone returned a DataFrame or a long list; the backend swap plus a cleanup (airflow db clean --tables xcom) fixes it. Slow DAG parsing with many database connections in the scheduler log is module-level Variable.get.
The consideration is that XComs are visible in the UI to anyone with DAG read access, so a credential or personal data must never travel through them.
65Explain Airflow connections and secrets in the context of Apache Spark / Kafka / Airflow.
A connection is Airflow’s object for “how to reach an external system”: a conn_id, a connection type (postgres, aws, spark, kafka, kubernetes), host, port, login, password, schema and an extra JSON for type-specific options such as a Kafka bootstrap.servers, security.protocol and SASL credentials. Hooks and operators take a conn_id and build their client from it, so the DAG code contains no endpoints or credentials and the same DAG runs in dev and prod against different connections.
Connections and Variables can come from several places, checked in order: a configured secrets backend, then environment variables (AIRFLOW_CONN_<ID> as a URI or JSON, AIRFLOW_VAR_<KEY>), then the metadata database. Secrets backends are the production answer: HashiCorp Vault, AWS Secrets Manager, AWS Systems Manager Parameter Store, GCP Secret Manager, Azure Key Vault, or a LocalFilesystemBackend for development. The backend maps a conn_id to a path (connections_path / variables_path prefixes) and Airflow reads it on demand, so rotation in the vault takes effect without touching Airflow. Values in the metadata database are encrypted with the Fernet key from core.fernet_key; losing that key makes stored passwords unreadable.
Secrets that reach a task should be consumed inside the task through the hook, not pushed through XCom or logged. Airflow masks values of connection passwords and of any variable whose name contains password, secret, api_key and similar (sensitive_var_conn_names) in task logs. In Airflow 3, tasks obtain connections through the Task Execution API rather than a direct database connection, which lets workers run without database credentials at all.
66In a real project using Apache Spark / Kafka / Airflow, how would you apply, test, or troubleshoot Airflow connections and secrets?
Apply. All production connections live in HashiCorp Vault under airflow/connections/<conn_id>, exposed through the VaultBackend with Kubernetes auth so Airflow pods authenticate with their service account; there is no connection in the metadata database and the UI’s “Add connection” is disabled for non-admins. The kafka_orders connection carries the SCRAM credentials in extra, and the spark_k8s connection points at the cluster with an in-cluster service account. Secrets rotation is a Vault job; the Kafka provider’s hook reads the connection per task run, so rotation needs no redeploy. Spark jobs do not receive credentials from Airflow at all; the SparkKubernetesOperator references a Kubernetes secret mounted into the driver pod, keeping Airflow out of the Spark secret path.
Test. airflow connections test kafka_orders (or the connection test button, enabled via test_connection=Enabled) is run by the deployment pipeline against staging. A unit test for the DAG asserts every conn_id referenced exists in a checked-in manifest, so a typo in conn_id fails CI, not production at 3 a.m. A log-scan test produces a task with a known fake secret and asserts it appears masked (***) in the log output.
Troubleshoot. AirflowNotFoundException: The conn_id ... isn't defined with the connection visible in Vault is almost always a path mismatch (connections_path or a mount point) or missing Vault policy for the Airflow role; enabling debug logging for airflow.providers.hashicorp shows the attempted path. InvalidToken from Fernet after a migration means the Fernet key changed; connections must be re-entered or the old key supplied via key rotation. Kafka SaslAuthenticationException after rotation means a cached connection object in a long-running custom hook; recreating the hook per task fixes it.
The consideration is that Variables and connections fetched from a secrets backend are read on every access, so reading them in a loop or at parse time hammers the vault and can hit its rate limits.
67Explain Airflow retries and SLAs in the context of Apache Spark / Kafka / Airflow.
Retries are per-task: retries sets how many times a failed task instance is re-queued, retry_delay the wait between attempts, retry_exponential_backoff=True with max_retry_delay grows the wait, and execution_timeout kills a task that runs too long so that it fails and can be retried. Between attempts the task is in state up_for_retry, and each attempt gets its own log. Retries are only safe when the task is idempotent, which is why Spark writes are designed as partition overwrites or MERGEs and Kafka producers carry a run ID. on_failure_callback and on_retry_callback hook notifications; trigger_rule on downstream tasks (all_success, all_done, one_failed, none_failed_min_one_success) decides what happens to the rest of the DAG.
default_args = {
    "retries": 3,
    "retry_delay": timedelta(minutes=5),
    "retry_exponential_backoff": True,
    "max_retry_delay": timedelta(minutes=30),
    "execution_timeout": timedelta(hours=2),
    "on_failure_callback": notify_slack,
}
SLAs in Airflow 1.x and 2.x were a per-task sla=timedelta(...) measured from the DAG run’s scheduled time; a miss was recorded in the SLA Misses table and passed to the DAG’s sla_miss_callback. The feature was unreliable (it only worked on scheduled runs, and the callback ran in the scheduler) and it was removed in Airflow 3.0. Airflow 3.1 introduced Deadline Alerts (experimental) as the replacement: a DAG-level deadline defined by a reference point (DAG run queued time, logical date, or a fixed time), an interval, and a callback such as a notifier, evaluated independently of task execution.
Retries handle failure; SLAs or deadlines handle lateness, and the two interact: a generous retry policy can turn a failure into an SLA miss, so both must be set with the downstream consumer’s deadline in mind.
68In a real project using Apache Spark / Kafka / Airflow, how would you apply, test, or troubleshoot Airflow retries and SLAs?
Apply. In the lakehouse DAG, retries are tuned per task type: the S3 sensor has none (it already waits), the Spark job has two retries with a 10-minute delay because most failures are transient spot-node losses, and the publish task has five fast retries because it is a metastore call. The Spark task’s execution_timeout is set to three times its normal runtime so a hung driver is killed rather than consuming the deadline. Lateness is handled at the DAG level: on Airflow 2.x, an sla on the final task with an sla_miss_callback that pages; on Airflow 3.1, a Deadline Alert referencing the run’s queued time plus four hours with a Slack notifier. Downstream, the reporting DAG uses an ExternalTaskSensor with its own timeout instead of assuming the upstream met its deadline.
Test. Idempotence under retry is the key test: airflow tasks test runs the Spark task twice for the same interval and the output table checksum must not change. Failure-path tests force an exception in a task and assert the callback fires with the expected context and that trigger_rule=all_done tasks (cleanup) still run. The timeout is tested by a task that sleeps past execution_timeout and must end in failed then up_for_retry.
Troubleshoot. A task that succeeds on retry every day is masking a real problem, often a race with an upstream still writing; the fix is a proper sensor. A DAG that breaches its deadline despite every task succeeding has the lateness in queueing (pool exhaustion) or in a sensor waiting, visible in the Gantt view. On Airflow 2.x, SLA misses not firing usually means the DAG was triggered manually (SLAs only apply to scheduled runs) or the scheduler’s callback failed silently.
The consideration is that exponential backoff plus many retries can push a task past the business deadline before it ever reports failure; the retry budget must fit inside the SLA window.
69Explain Airflow catchup and backfill in the context of Apache Spark / Kafka / Airflow.
Airflow schedules a DAG for every data interval between start_date and now. Catchup controls what happens when there are intervals in the past that have never run, for example because the DAG was deployed with a start_date of last month or was paused for a week. With catchup=True the scheduler creates a DAG run for every missed interval, in order, as soon as the DAG is unpaused; with catchup=False it creates only the most recent one. The historic default was True; Airflow 3 changed the default of catchup_by_default to False, which matches what most teams had already set, because an unexpected flood of runs is a common incident.
Backfill is the deliberate version of the same idea: re-running or filling a specific date range. In Airflow 2 it is the CLI command airflow dags backfill -s 2026-10-01 -e 2026-10-31 my_dag (optionally --reset-dagruns to rerun existing runs), which runs through a local executor from the CLI process. Airflow 3 moved backfills into the scheduler and API: they are created from the UI or airflow backfill create, run through the normal executor with configurable max_active_runs, can be paused and cancelled, and have a reprocess_behavior option (none, failed, completed) deciding whether existing runs are redone. Because every run receives its own data_interval_start and data_interval_end, a well-written task computes exactly the slice of data for that interval, which is what makes backfilling a month of Spark jobs mechanical rather than a manual script.
Catchup is an accident waiting to happen when start_date is far in the past; backfill is the controlled tool for the same job. Neither helps a DAG whose tasks ignore the interval and always process “today”.
70In a real project using Apache Spark / Kafka / Airflow, how would you apply, test, or troubleshoot Airflow catchup and backfill?
Apply. Every DAG sets catchup=False explicitly regardless of version, and max_active_runs=1 where runs share a Spark cluster, so a resumed DAG never launches thirty parallel Spark jobs. Tasks derive their input from the interval: the Spark job receives {{ data_interval_start | ds }} and {{ data_interval_end | ds }} as arguments and reads Kafka-landed Parquet for exactly that window, overwriting that partition. When a schema fix requires reprocessing October, I run a backfill (Airflow 3 UI with reprocess_behavior=completed, or airflow dags backfill --reset-dagruns on 2.x) with max_active_runs=3 sized to the Spark cluster’s capacity, and a backfill DAG parameter switches the Spark job to a larger executor profile.
Test. airflow dags test my_dag 2026-10-15 runs one historic interval locally and the test asserts that only the dt=2026-10-15 partition changed. A second test runs two intervals in reverse order and asserts each only touched its own partition, which proves there is no “today” logic. In staging I rehearse the backfill on a week of data to confirm the concurrency setting and the cluster’s autoscaling cope.
Troubleshoot. A newly deployed DAG that immediately launches dozens of runs had catchup=True with an old start_date; pausing the DAG, marking the unwanted runs failed and fixing the flag stops it. Backfilled runs that produce identical output for every date reveal a task using datetime.now() or {{ ds }} incorrectly. A backfill stuck behind the regular schedule on 2.x is the CLI backfill competing for pools; on 3.x the backfill’s max_active_runs and the pool size are the knobs.
The consideration is that backfilling a Spark job that also publishes to Kafka re-emits historical events, so the producer side of the task should be disabled or guarded when dag_run.run_type == "backfill".
71Explain Airflow dynamic task mapping in the context of Apache Spark / Kafka / Airflow.
Dynamic task mapping (Airflow 2.3+) lets a DAG create a variable number of task instances at runtime, based on the output of an upstream task, instead of fixing the number when the file is parsed. expand() maps a task over an iterable, partial() supplies the arguments that stay constant, and the scheduler creates one mapped task instance per element, each with its own map_index, state, retries and log. A downstream task that receives the mapped output gets all results as a lazy sequence (a reduce step).
@task
def list_partitions() -> list[str]:
    return ["dt=2026-11-04", "dt=2026-11-05", "dt=2026-11-06"]

@task
def compact(partition: str, table: str):
    run_spark_compaction(table, partition)

compact.partial(table="orders").expand(partition=list_partitions())
Operators work the same way, for example SparkSubmitOperator.partial(...).expand(application_args=[...]), and expand_kwargs maps over a list of dictionaries when arguments vary together. Mapping is limited by max_map_length (default 1024) per task, and max_active_tis_per_dag or max_active_tis_per_dagrun throttles concurrency. It is the supported replacement for generating tasks with Python loops over data that only exists at runtime, and for the SubDAG pattern that Airflow 3 removed.
The input to expand must be small and serialisable because it travels through XCom. Mapping fan-out is for work units of meaningful size; thousands of one-second tasks cost more in scheduling overhead than they save.
72In a real project using Apache Spark / Kafka / Airflow, how would you apply, test, or troubleshoot Airflow dynamic task mapping?
Apply. A nightly job must compact every Delta partition modified the previous day, a number that varies from 5 to 400. A first task queries the table history and returns the list of partition paths; a mapped compact task launches one Spark job per path, with max_active_tis_per_dagrun=20 so the Spark cluster is not flooded, and a final reduce task collects the mapped results to write a summary row. Tenants in a multi-tenant Kafka setup are handled the same way: one mapped task per tenant topic to run an offset-lag check. Where groups of partitions are tiny, the first task batches them into chunks of 20 so each mapped instance has real work.
Test. The list-producing function is plain Python and unit-tested with fixtures, including the empty case. A DAG test with airflow dags test runs the mapped task for a fixture of three partitions and the test asserts three mapped instances reached success. An explicit test covers zero elements: the mapped task is marked skipped, so downstream tasks need a suitable trigger_rule such as none_failed.
Troubleshoot. A mapped task that yields no instances and a skipped downstream usually means the upstream returned an empty list. ValueError: The mapped task ... exceeded max_map_length means the fan-out is too large; chunk it. One failed map_index does not fail the others, so I read the per-index state in the Grid view and clear only the failed instances. Slow scheduling with several thousand mapped instances points to excessive granularity.
The consideration is that mapped inputs are stored in XCom, so a list of large objects bloats the metadata database; pass identifiers, not payloads.
73Explain Airflow executors in the context of Apache Spark / Kafka / Airflow.
An executor is the component the scheduler hands ready task instances to, and it determines where and how those tasks actually run. It is configured with [core] executor, and in Airflow 2.10+ more than one can be configured at once, with individual tasks choosing via the executor argument.
The diagram shows how the scheduler hands task instances to an executor, which runs them on Celery workers or per-task pods.
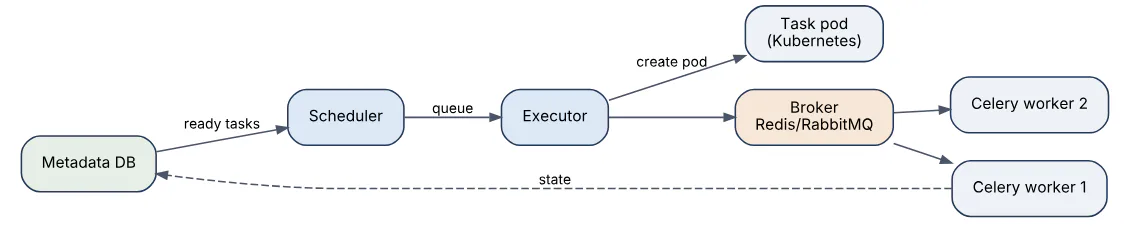
| Executor | Where tasks run | Typical use |
|---|---|---|
LocalExecutor | Subprocesses on the scheduler host | Small deployments, development |
CeleryExecutor | Long-lived Celery workers via a broker | Steady, high task volume |
KubernetesExecutor | One pod per task instance | Bursty, isolated, per-task images |
CeleryKubernetesExecutor | Both, routed by queue (deprecated) | Superseded by multi-executor config |
SequentialExecutor runs one task at a time and exists only for tests. Celery workers are always-warm and have low task start latency but need a broker (Redis or RabbitMQ) and capacity planning. The Kubernetes executor gives per-task resource requests and images and scales to zero, at the cost of pod start-up time of several seconds per task, which hurts very short tasks. Airflow 3 introduced the edge executor (in the edge3 provider) for running tasks on remote machines over HTTP, and the Task SDK interface makes workers independent of the metadata database.
The executor schedules Airflow tasks, not Spark work: a SparkSubmitOperator task occupies one executor slot whether it submits to YARN or Kubernetes, so heavy computation belongs in the Spark cluster, with Airflow merely orchestrating it. Choosing an executor is a trade between start latency, isolation and operational burden.
74In a real project using Apache Spark / Kafka / Airflow, how would you apply, test, or troubleshoot Airflow executors?
Apply. For a platform running about 400 DAGs, mostly light orchestration tasks that submit Spark jobs or call APIs, I use the CeleryExecutor with autoscaled workers for the high-volume short tasks and the KubernetesExecutor, via multi-executor configuration, for the few tasks that need their own container image or a large memory request, such as a Python data-validation step with heavy libraries. Spark computation itself runs on its own Kubernetes cluster through deferrable operators, so Airflow worker count stays small. Queues and pools separate classes of work: a spark pool of 10 slots protects the Spark cluster, and max_active_tasks limits each DAG.
Test. A load test triggers 200 parallel dummy tasks and measures queue-to-start latency on both executors, which sets the expectation for short tasks. A failure test kills a Celery worker mid-task and a Kubernetes pod mid-task and verifies the task retries and the scheduler marks the original attempt failed. Capacity is validated by confirming parallelism and worker concurrency add up to the intended maximum.
Troubleshoot. Tasks sitting in queued while workers are idle suggest a Celery queue mismatch (the worker does not listen to the task’s queue) or a broker problem; celery inspect active shows what workers hold. With the Kubernetes executor, kubectl describe pod explains tasks stuck in queued: unschedulable resource requests, image pull errors or quota limits. Tasks killed with SIGKILL and no log are typically pod OOMKilled events and need a larger memory request.
The consideration is that raising parallelism without raising the metadata database and broker capacity just moves the bottleneck there.
75Explain Airflow data interval scheduling in the context of Apache Spark / Kafka / Airflow.
Since Airflow 2.2, every DAG run represents a data interval: the half-open period of data it is responsible for, with a data_interval_start and data_interval_end. A run is triggered only after its interval has ended. A daily DAG with schedule="@daily" therefore runs for the interval 2026-11-05 00:00 to 2026-11-06 00:00 at 2026-11-06 00:00, which is why the run “for November 5th” starts on the 6th. The logical_date of a scheduled run equals data_interval_start (the older name execution_date was deprecated in 2.2 and removed in Airflow 3); a run’s real start is a separate run_after /start timestamp.
Schedules are expressed with schedule= taking a cron string, a preset such as @hourly, a timedelta, or a timetable object (CronTriggerTimetable triggers at the cron time itself with the interval ending then, unlike the default CronDataIntervalTimetable). schedule_interval was replaced by schedule, and manual runs have an interval that is just the trigger moment in Airflow 3, which stopped assigning a logical date to manual runs by default. Templates expose the interval as {{ data_interval_start }}, {{ data_interval_end }} and the shortcuts {{ ds }} (the logical date as YYYY-MM-DD).
Reading data by interval, not by “now”, is the core idea: it makes each run reproducible, idempotent and re-runnable. A Spark job parameterised with the interval boundaries processes the same files whether it runs on time, late or in a backfill. Use CronTriggerTimetable when the job should consume whatever exists at trigger time rather than a closed past window.
76In a real project using Apache Spark / Kafka / Airflow, how would you apply, test, or troubleshoot Airflow data interval scheduling?
Apply. An hourly Kafka-to-lake load uses schedule="0 * * * *" and passes {{ data_interval_start }} and {{ data_interval_end }} to the Spark job, which filters records by Kafka timestamp inside that window and overwrites the dt=.../hour=... partition, so reruns are exact. A daily finance DAG uses {{ ds }} as the business date. For a DAG that must start exactly at 06:00 whatever data exists, I use CronTriggerTimetable("0 6 * * *", timezone="Europe/Berlin"), and I always set an explicit time zone so daylight-saving changes do not shift or duplicate runs. Start dates are fixed values, never datetime.now().
Test. A test computes the expected interval for a given schedule through the DAG’s timetable (dag.timetable.next_dagrun_info) and asserts the boundaries, including a DST transition day. airflow dags test my_dag 2026-11-05 confirms the rendered arguments (airflow tasks render) contain the expected interval, and a data test confirms the output partition holds records only from that window.
Troubleshoot. “My DAG did not run today” is nearly always the interval model: the run for today starts when today ends. A late-arriving record missing from its hour is a window defined on processing time rather than event time; the fix is a reprocessing buffer or a longer watermark. Runs a day off in reports come from mixing ds with data_interval_end, or from timezone-naive start dates interpreted in UTC. On Airflow 3, DAG code reading execution_date fails because it was removed and needs logical_date or the interval fields.
The consideration is that the interval describes data coverage, not wall-clock time, so a delayed DAG run still processes the correct window.
77Explain Airflow production monitoring in the context of Apache Spark / Kafka / Airflow.
Production monitoring of Airflow covers four layers: the platform’s health, the scheduling pipeline’s timeliness, the individual DAG and task outcomes, and the data they produce.
- Platform health. The
/health(Airflow 2) or/api/v2/monitor/health(Airflow 3) endpoint reports metadatabase, scheduler, triggerer and DAG processor heartbeats. Airflow emits metrics through StatsD or OpenTelemetry ([metrics]section) and the standard approach is exporting them to Prometheus and Grafana. - Scheduler and capacity metrics.
scheduler.heartbeat,scheduler.tasks.starving,pool.open_slotsandpool.queued_slots,executor.queued_tasks,dagrun.schedule_delay.<dag_id>anddag_processing.total_parse_timeshow whether the scheduler keeps up and whether pools are saturated. - Task and DAG outcomes.
ti.finish.<dag>.<task>.<state>counts, run durations (dagrun.duration.success),on_failure_callbackalerts to Slack or PagerDuty, and in Airflow 3.1 Deadline Alerts for lateness (replacing the SLAs removed in 3.0). - Logs. Task logs shipped to remote storage (S3, GCS, Elasticsearch/OpenSearch) via
remote_loggingso they survive pod deletion. - Data-level checks. Row counts, freshness and uniqueness checks as tasks inside the DAG, because a green DAG that wrote nothing is still a failure.
Monitoring of the surrounding tools is separate: Spark’s History Server and Prometheus metrics for the jobs Airflow launches, and Kafka consumer lag for sensors and producers.
A useful alert is actionable and tied to a business deadline, such as “the orders mart is not fresh by 07:00”; a failure alert on every retried task generates noise that people learn to ignore.
78In a real project using Apache Spark / Kafka / Airflow, how would you apply, test, or troubleshoot Airflow production monitoring?
Apply. The Airflow deployment on Kubernetes exports StatsD metrics through the statsd-exporter into Prometheus. Grafana boards show scheduler heartbeat, DAG parse time, queued versus running tasks per pool and the schedule delay per critical DAG. Alertmanager pages on a missing scheduler heartbeat for two minutes, pool.open_slots == 0 for the spark pool for more than 15 minutes, and the freshness of the three tables the business reads. Task failures after final retry call a shared notify_failure callback that posts the DAG, task, run ID and log link to Slack and opens an incident for tier-1 DAGs. Logs go to S3 with remote_logging=True, and airflow db clean runs weekly to keep the metadata database small.
Test. I test the alerting itself, not just the dashboards: a canary DAG that fails on purpose weekly must produce a Slack message and a page in the staging environment, and stopping the scheduler pod must trigger the heartbeat alert. A data-quality task inside tier-1 DAGs is tested with a fixture containing a duplicate key to confirm that the DAG fails.
Troubleshoot. Rising dag_processing.total_parse_time means a DAG file doing network calls at import; I find it with airflow dags report. Tasks starving (scheduler.tasks.starving) with free workers indicates pool or max_active_tasks limits. A slow UI and scheduler lag together point to a bloated metadata database (XComs, task instances) or missing indexes. When a DAG is “green but wrong”, the data-quality checks, row-count trend and the Spark History Server of the job reveal it.
The consideration is that monitoring the orchestrator alone says nothing about data correctness, so freshness and volume checks must be part of the pipeline’s definition of success.
79Explain Airflow dataset-aware scheduling in the context of Apache Spark / Kafka / Airflow.
Dataset-aware scheduling (Airflow 2.4+) triggers a DAG when the data it depends on has been updated, instead of at a fixed time. A producer task declares what it updates with outlets=[Dataset("s3://lake/orders")]; when that task succeeds, Airflow records a dataset event, and any consumer DAG whose schedule= lists that dataset is triggered. Consumers can wait for several datasets (schedule=[orders, payments] means all must have been updated since the last run), combine them with logical expressions ((a | b) & c, from 2.9), or be driven by a combination of a cron timetable and datasets.
The diagram shows a producer DAG updating a dataset and triggering consumer DAGs without a shared clock.
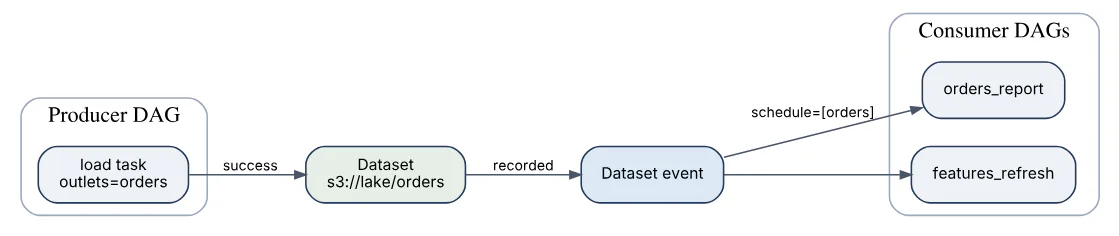
In Airflow 3.0 the feature was renamed Assets, as part of the asset-centric authoring model: from airflow.sdk import Asset, asset, with @asset as a decorator that defines a DAG producing one asset, and schedule=[Asset("...")] on consumers. Alongside the rename came watchers: an AssetWatcher attached to an asset with a message-queue trigger (such as the common-messaging provider’s Kafka or SQS triggers) lets an external event, such as a Kafka message, mark an asset updated and start a DAG, which makes Airflow event-driven. The Airflow 2.x Dataset import path still works through a compatibility layer, but new code should use Asset.
from airflow.sdk import Asset, DAG, task

orders = Asset("s3://lake/orders")

with DAG("build_orders", schedule="@hourly"):
    @task(outlets=[orders])
    def load(): ...

with DAG("orders_report", schedule=[orders]):
    @task
    def report(): ...
An asset event says only that the producing task succeeded, not that the data is correct or which interval it covers; consumers should still process by interval or by explicit metadata passed with the event.
80In a real project using Apache Spark / Kafka / Airflow, how would you apply, test, or troubleshoot Airflow dataset-aware scheduling?
Apply. The orders pipeline has a producer DAG that lands Kafka data and runs a Spark job, with its final task declaring outlets=[Asset("s3://lake/orders_clean")]. Three consumers (a daily revenue mart, a fraud-feature refresh and a data-quality DAG) are scheduled on that asset instead of three cron times, removing the guesswork about when upstream finishes. The revenue mart needs two inputs and uses schedule=[orders_clean, fx_rates], so it runs once both have been refreshed. Producers attach metadata (outlet_events[asset].extra = {"partition": "dt=2026-11-05"}) which the consumer reads to know which partition to process, so a missed or doubled event does not guess the window. For cross-system triggers, an AssetWatcher on a Kafka control topic lets an external team’s “files ready” message update the asset.
Test. A test DAG run on staging runs the producer and asserts a consumer DAG run is created, with the event visible in the Assets view. A unit test builds the DAG and asserts dag.timetable is asset-triggered with the expected asset URIs, which guards against a typo in a URI string (assets are matched by exact URI). A failure test makes the producer fail and asserts no asset event and no consumer run.
Troubleshoot. A consumer that never runs usually has a URI mismatch (trailing slash, different scheme) between outlet and schedule, or is waiting for a second asset that has not updated; the Assets page shows each asset’s last event and the pending queue. A consumer that runs too often means the producer emits one event per mapped task or per retry-success; collapse emission to the final task. Events that fire for runs that were manually cleared and re-run produce duplicate consumer runs, so consumers must be idempotent.
The consideration is that asset scheduling couples DAGs through the metadata database, so a long chain makes the dependency graph hard to reason about; the Assets graph view is the tool for keeping it understandable.
Answers tailored to your resume and job description
Add your resume and the job description in CrackItX's Settings. When the interviewer asks a Apache Spark / Kafka / Airflow question, Claude suggests an answer using your real projects and the role's requirements, in real time.
See pricing →