Top 50 Amazon Web Services (AWS)
interview questions
EC2, S3, IAM, VPC, Lambda, RDS and well-architected design. Open a question to read the answer.
01Explain AWS regions availability zones in the context of Amazon Web Services (AWS).
A Region is a geographic area (for example eu-west-1, Ireland) containing several isolated data-center groups called Availability Zones (AZs). Each AZ is one or more physically separate facilities with independent power, cooling and networking, connected to the other AZs in the Region by low-latency private fibre. Most Regions have three or more AZs, and AZ names such as eu-west-1a are mapped differently per account, so the stable identifier is the AZ ID (euw1-az1).
Key points:
- Resources are either regional (S3 buckets, DynamoDB tables, IAM is global) or zonal (EC2 instances, EBS volumes, subnets). A subnet lives in exactly one AZ.
- Regions are fully independent; data does not leave a Region unless you replicate it, which matters for data-residency rules.
- Spreading instances across AZs is the standard way to survive a data-center failure without cross-region complexity.
- Local Zones and Wavelength Zones extend a Region’s infrastructure closer to users for latency-sensitive workloads.
The diagram shows the typical layout of a highly available deployment inside one Region.
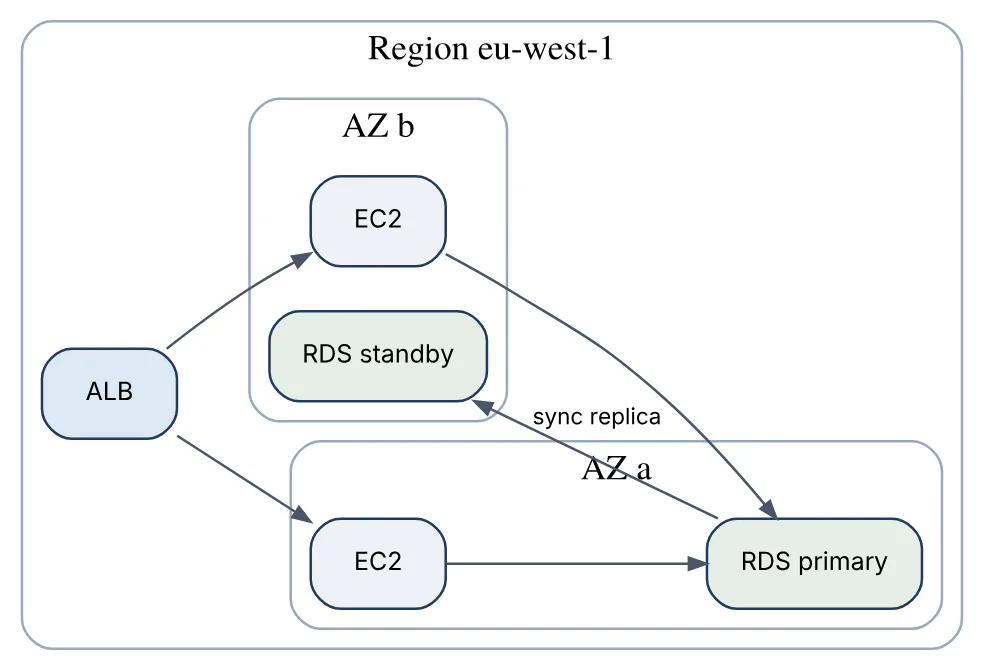
Interview takeaway: AZs give fault isolation at millisecond latency; Regions give geographic and regulatory isolation at the cost of replication effort.
02In a real project using Amazon Web Services (AWS), how would you apply, test, or troubleshoot AWS regions availability zones?
Apply. For an order-processing platform I would pick one primary Region close to customers and legal data residency, then create a VPC with at least two subnets per tier across three AZs. The Auto Scaling group spans all three, the ALB has a subnet in each, RDS runs Multi-AZ, and ElastiCache uses a replication group with replicas in different AZs. Zonal resources are tagged with their AZ ID so cost and failure analysis can be grouped later.
Test. AZ resilience is verified with AWS Fault Injection Service: an experiment template uses the aws:network:disrupt-connectivity action against one AZ’s subnets while a load test runs. Success criteria are expressed as CloudWatch alarms on ALB 5xx rate and p99 latency that must stay green, and I check that the ASG replaces instances in the healthy zones and that RDS fails over within its documented window.
Troubleshoot. A common symptom is InsufficientInstanceCapacity when scaling in a single AZ; the fix is adding more AZs to the group and mixing instance types. Another is unexpected inter-AZ data-transfer cost; I enable cross-zone load balancing awareness, check VPC Flow Logs for east-west traffic, and move chatty components into the same AZ or use AZ-aware routing in the service mesh.
Important consideration: AZ letters differ between accounts, so cross-account designs must compare AZ IDs, not names.
03Explain IAM users roles and policies in the context of Amazon Web Services (AWS).
IAM (Identity and Access Management) controls who can call which AWS API on which resource. The three building blocks are:
- Users are long-lived identities for people or legacy applications with a password or access keys. Current guidance is to avoid them for humans and use federated identities through IAM Identity Center instead.
- Roles are identities with no permanent credentials. A principal (an EC2 instance, a Lambda function, a user in another account, an OIDC federated workload such as GitHub Actions) assumes the role through STS and receives short-lived credentials. The role’s trust policy states who may assume it.
- Policies are JSON documents listing
Effect,Action,Resourceand optionalCondition. Identity-based policies attach to users, groups or roles; resource-based policies (S3 bucket policies, KMS key policies) attach to the resource itself.
Evaluation logic: an explicit Deny anywhere wins; otherwise the request needs an Allow within the intersection of identity policy, resource policy, permissions boundary, SCPs and session policy.
{
  "Version": "2012-10-17",
  "Statement": [{
    "Effect": "Allow",
    "Action": ["s3:GetObject", "s3:PutObject"],
    "Resource": "arn:aws:s3:::orders-archive/2026/*",
    "Condition": {"Bool": {"aws:SecureTransport": "true"}}
  }]
}
This identity policy grants read and write only to one prefix and only over TLS, which is the least-privilege style interviewers expect.
04In a real project using Amazon Web Services (AWS), how would you apply, test, or troubleshoot IAM users roles and policies?
Apply. In a multi-account organisation I give every workload its own role: the payments ECS task role can read one Secrets Manager secret and write one SQS queue, nothing else. CI/CD assumes a deployment role via GitHub OIDC federation, so no access keys exist in the pipeline. Humans sign in through IAM Identity Center permission sets, and Service Control Policies block root usage and disallowed Regions. Permissions boundaries let platform teams delegate role creation to developers without letting them escalate.
Test. Policies are validated before deployment with IAM Access Analyzer policy checks (check-no-new-access, validate-policy) in the pipeline. The IAM Policy Simulator confirms that a role can and cannot perform specific actions on specific ARNs. Integration tests run with the real role via aws sts assume-role and assert that denied calls return AccessDenied. After a few weeks in production, Access Analyzer’s unused-access findings and the role’s last-accessed data show which permissions can be removed.
Troubleshoot. The typical error is AccessDenied or not authorized to perform ... with an explicit deny. I read the full error (it names the policy type), search CloudTrail for the event, and check the five evaluation layers in order: SCP, permissions boundary, identity policy, resource policy, and KMS key policy for encrypted resources. Cross-account S3 failures are usually a missing bucket policy, not the identity policy.
Important consideration: iam:PassRole and sts:AssumeRole are the usual privilege-escalation paths, so they must be scoped to specific role ARNs.
05Explain EC2 instances and autoscaling in the context of Amazon Web Services (AWS).
An EC2 instance is a virtual machine chosen by instance type (family such as m7g, c7i, r8g plus size), launched from an AMI into a subnet, with EBS or instance-store storage and a security group. Purchase options are On-Demand, Spot (spare capacity at steep discount, reclaimable with two minutes’ notice), and commitment-based Savings Plans or Reserved Instances.
Auto Scaling manages a fleet of such instances through an Auto Scaling group (ASG):
- A launch template defines AMI, instance type(s), user data, IAM instance profile and network settings.
- The ASG keeps the count between
MinSizeandMaxSize, replaces instances that fail EC2 or ELB health checks, and balances them across the configured AZs. - Scaling policies change the desired capacity: target tracking (keep average CPU at 50%), step scaling on alarms, scheduled scaling, and predictive scaling based on learned daily patterns.
- Warm pools, lifecycle hooks and instance refresh handle slow boot times, graceful draining and rolling AMI updates.
Mixed-instance policies let one group blend On-Demand and Spot across several instance types, which is the standard pattern for cost-efficient stateless web tiers behind a load balancer.
06In a real project using Amazon Web Services (AWS), how would you apply, test, or troubleshoot EC2 instances and autoscaling?
Apply. For the web tier of an e-commerce site I would bake a hardened AMI with EC2 Image Builder, reference it from a launch template, and run an ASG across three AZs with a mixed-instances policy (several c7i / c7a sizes, roughly 30% On-Demand base and the rest Spot). Target tracking on ALBRequestCountPerTarget scales with real traffic rather than CPU, and a scheduled action pre-warms before the daily 9 a.m. spike. A lifecycle hook on termination drains in-flight requests and ships logs before the instance disappears.
Test. Load tests with k6 or Distributed Load Testing on AWS confirm the group reaches the required capacity within the SLA and that the ALB health check (/healthz, 2 healthy / 3 unhealthy thresholds) marks slow instances correctly. I deliberately terminate instances and simulate Spot interruptions with Fault Injection Service to confirm replacements join the target group without 5xx spikes. Instance refresh is rehearsed in staging with a 90% minimum healthy percentage.
Troubleshoot. Flapping instances usually mean the application starts slower than the health-check grace period; the fix is raising HealthCheckGracePeriod or using a warm pool. Repeated Spot capacity not available events call for more instance types or the capacity-optimized allocation strategy. The ASG activity history and aws autoscaling describe-scaling-activities show exactly why a launch failed.
Important consideration: scaling policies react to metrics with a lag, so cooldowns and instance warm-up must match real boot time or the group oscillates.
07Explain S3 buckets storage classes in the context of Amazon Web Services (AWS).
S3 stores objects (up to 5 TB each) in buckets with globally unique names; every object carries a storage class that determines durability, availability, latency and price. All classes except One Zone variants replicate across at least three AZs and are designed for eleven nines of durability.
| Class | Retrieval | Typical use |
|---|---|---|
| S3 Standard | Immediate | Frequently accessed data, web assets |
| S3 Intelligent-Tiering | Immediate, auto-moves between tiers | Unknown or changing access patterns |
| S3 Standard-IA / One Zone-IA | Immediate, per-GB retrieval fee | Backups, data read a few times a year |
| S3 Express One Zone | Single-digit ms, directory buckets | Latency-critical analytics and ML |
| S3 Glacier Instant / Flexible / Deep Archive | ms, minutes-hours, up to 12-48 h | Archives, compliance retention |
Lifecycle rules transition objects between classes or expire them, for example Standard to Standard-IA after 30 days and to Glacier Deep Archive after 180. Infrequent-access and Glacier classes charge minimum storage durations (30, 90 or 180 days) and have a 128 KB minimum billable size, so tiny objects are cheaper left in Standard. Intelligent-Tiering is the safe default when access patterns are unknown because it has no retrieval fee.
08In a real project using Amazon Web Services (AWS), how would you apply, test, or troubleshoot S3 buckets storage classes?
Apply. In a document-management system, uploaded invoices land in S3 Standard because they are viewed heavily for the first month. A lifecycle rule moves them to Standard-IA after 30 days and to Glacier Flexible Retrieval after one year, with a seven-year expiry to meet retention policy. Log buckets written by CloudFront and ALB go straight to Intelligent-Tiering since nobody knows which days will be investigated. Versioning plus a rule that expires noncurrent versions after 90 days protects against accidental deletes without unbounded growth.
{"Rules": [{
  "ID": "invoice-tiering", "Status": "Enabled",
  "Filter": {"Prefix": "invoices/"},
  "Transitions": [
    {"Days": 30,  "StorageClass": "STANDARD_IA"},
    {"Days": 365, "StorageClass": "GLACIER"}],
  "Expiration": {"Days": 2555}
}]}
Test. S3 Storage Lens and the Storage Class Analysis report confirm that objects actually age into the expected classes and that retrieval costs stay below the storage savings. Restore paths are rehearsed: a scripted RestoreObject with the Bulk tier for Glacier objects, measured against the business RTO.
Troubleshoot. A surprise bill is the usual symptom. Cost Explorer filtered by usage type shows whether it is early-deletion fees (objects transitioned before the minimum duration), per-request retrieval fees on IA classes, or millions of small objects below 128 KB being charged as 128 KB. Access failures on archived objects return InvalidObjectState until a restore completes, which application code must handle.
Important consideration: lifecycle transitions themselves cost a per-request fee, so transitioning hundreds of millions of tiny objects can cost more than it saves.
09Explain VPC public private subnets in the context of Amazon Web Services (AWS).
A VPC is an isolated virtual network with its own CIDR range (for example 10.0.0.0/16) in one Region; subnets carve that range into per-AZ segments. Whether a subnet is public or private is decided purely by its route table:
- A public subnet has a route
0.0.0.0/0 -> igw-xxxxto an Internet Gateway, and instances need a public or Elastic IP to be reachable. Load balancers, NAT gateways and bastion hosts live here. - A private subnet has no route to the Internet Gateway. Outbound internet access, if needed, goes through a NAT Gateway placed in a public subnet (
0.0.0.0/0 -> nat-xxxx); nothing on the internet can initiate a connection inward. Application servers, containers and databases belong here. - Isolated subnets have no internet route at all and reach AWS services via VPC endpoints (Gateway endpoints for S3 and DynamoDB, Interface endpoints via PrivateLink for most others).
The diagram shows the standard three-tier layout in one AZ.

A NAT gateway is zonal, so production designs deploy one per AZ to avoid cross-AZ dependencies.
10In a real project using Amazon Web Services (AWS), how would you apply, test, or troubleshoot VPC public private subnets?
Apply. For a payments platform I would allocate a /16 per environment from an IPAM pool and define, in each of three AZs, a /24 public subnet (ALB, NAT), a /20 private subnet (ECS tasks, Lambda ENIs, which consume many addresses) and a /24 isolated subnet (Aurora, ElastiCache). Gateway endpoints for S3 and DynamoDB plus interface endpoints for ECR, Secrets Manager and CloudWatch Logs keep service traffic off the NAT gateways, which cuts both cost and exposure. Everything is expressed in Terraform so the layout is identical across accounts.
Test. VPC Reachability Analyzer proves, before go-live, that the ALB can reach the task port and that nothing on the internet can reach the database subnet. Network Access Analyzer scopes check continuously that no isolated subnet acquires an internet route. A simple smoke test from a task (curl -m 5 https://api.example.com) confirms NAT egress, and nslookup of the Secrets Manager endpoint should resolve to a private VPC IP.
Troubleshoot. “Task stuck in PENDING, cannot pull image” almost always means a private subnet lost its NAT route or the ECR endpoints are missing; describe-route-tables and VPC Flow Logs (REJECT records) pinpoint it. Address exhaustion (InsufficientFreeAddressesInSubnet) is fixed by adding a secondary CIDR. Unexpectedly high NAT data-processing charges point to S3 or DynamoDB traffic that should be on a gateway endpoint.
Important consideration: subnet CIDRs cannot be resized after creation, so plan for Lambda and container IP consumption from the start.
11Explain security groups versus NACLs in the context of Amazon Web Services (AWS).
Both filter traffic inside a VPC, but they operate at different layers and with different semantics.
| Aspect | Security group | Network ACL |
|---|---|---|
| Attaches to | Elastic network interface (instance, ALB, RDS, Lambda) | Subnet |
| State | Stateful: return traffic automatically allowed | Stateless: must allow both directions, incl. ephemeral ports |
| Rules | Allow only; implicit deny | Allow and deny, evaluated by rule number |
| Default | Deny all inbound, allow all outbound | Default NACL allows all |
| Referencing | Can reference other security groups or prefix lists | CIDR ranges only |
Security groups are the primary control: a database group allowing port 5432 only from the application tier’s security group expresses intent without caring about IP addresses. NACLs are a coarse, defence-in-depth layer: blocking a known malicious CIDR at the subnet edge, or guaranteeing an isolated subnet can never talk to the internet even if someone misconfigures a group.
Because NACLs are stateless, a web subnet needs inbound 443 and outbound 1024-65535 for responses, which is the classic source of mysterious timeouts.
12In a real project using Amazon Web Services (AWS), how would you apply, test, or troubleshoot security groups versus NACLs?
Apply. In a three-tier ordering system I define one security group per role: sg-alb accepts 443 from 0.0.0.0/0, sg-app accepts 8080 only from sg-alb, and sg-db accepts 5432 only from sg-app. Outbound rules on sg-app are restricted to the database group and the HTTPS prefix list for S3 and other endpoints. NACLs stay close to default except on the isolated database subnet, where an explicit deny for 0.0.0.0/0 outside the VPC CIDR acts as a guard rail. All of it lives in Terraform with named rule descriptions so reviews are readable.
Test. Reachability Analyzer paths from the ALB ENI to a task on 8080 and from the internet to the database must return reachable and not-reachable respectively. Security Hub and AWS Config rules (restricted-ssh, vpc-sg-open-only-to-authorized-ports) flag any 0.0.0.0/0 inbound rule beyond 443. Penetration tests confirm that scans from outside see only the load balancer.
Troubleshoot. A connection that hangs rather than being refused suggests a filter. Flow Logs with REJECT on the instance ENI point at the security group; REJECT on the return path with high ports points at a stateless NACL missing ephemeral-port rules. Reachability Analyzer names the exact rule blocking the path, which is faster than reading rules by hand.
Important consideration: security groups have a per-ENI rule limit, so referencing other groups and managed prefix lists scales far better than listing CIDRs.
13Explain Route 53 DNS routing in the context of Amazon Web Services (AWS).
Route 53 is AWS’s authoritative DNS service plus domain registrar. Beyond ordinary A, AAAA, CNAME and TXT records it offers alias records, which point a zone apex such as example.com at an ALB, CloudFront distribution or S3 website without a CNAME and at no query cost. Routing policies decide which answer a resolver receives:
- Simple returns one record set; weighted splits traffic by percentages for canary or blue/green releases.
- Latency-based answers with the Region that gives the resolver the lowest measured latency.
- Failover returns the primary unless its health check fails, then the secondary, which is the basis of active-passive multi-region designs.
- Geolocation and geoproximity route by the caller’s location or by distance to resources, with an optional bias.
- Multivalue answer returns up to eight healthy records for cheap client-side load balancing.
Health checks probe an endpoint, another health check, or a CloudWatch alarm, and unhealthy records are withdrawn from answers. Private hosted zones serve internal names only inside associated VPCs, and Route 53 Resolver endpoints bridge on-premises DNS with VPC DNS in hybrid networks. Because TTLs are cached by resolvers worldwide, failover speed is bounded by the record TTL, which is why critical records use 60 seconds or less.
14In a real project using Amazon Web Services (AWS), how would you apply, test, or troubleshoot Route 53 DNS routing?
Apply. For a SaaS API served from eu-west-1 and us-east-1, I would create latency-based records for api.example.com, each an alias to the regional ALB with an associated health check that evaluates the target’s health. A weighted record pair on app.example.com carries 95/5 traffic during a canary release, adjusted by the pipeline. Inside the VPC, a private hosted zone gives services stable names like orders.internal pointing at an internal NLB, so hosts never hard-code IPs.
Test. dig +short api.example.com @ns-123.awsdns-45.com from several Regions (or a Route 53 health-checker view) confirms each resolver gets the expected Region. dig against the authoritative name server bypasses caches so TTL confusion does not skew results. In staging I force a health check to fail by returning 503 from the /healthz path and measure how long until queries move to the secondary, which should be health-check interval times failure threshold plus TTL.
Troubleshoot. Users still hitting a dead Region after failover usually means a long TTL or a corporate resolver ignoring TTLs; shortening TTL ahead of planned changes is the mitigation. Health checks reporting unhealthy while the site works typically indicate the security group does not allow the Route 53 health-checker IP ranges, or the check hits an endpoint behind authentication. For private zones, “name not resolving” is almost always a missing VPC association or enableDnsHostnames turned off.
Important consideration: Route 53 health checkers run from outside AWS, so they cannot test private endpoints; use CloudWatch-alarm-based health checks for those.
15Explain ELB ALB NLB in the context of Amazon Web Services (AWS).
Elastic Load Balancing (ELB) is the umbrella service; the current load balancer types are the Application Load Balancer, Network Load Balancer and Gateway Load Balancer, while the Classic Load Balancer is legacy and should not be chosen for new work.
| Aspect | ALB | NLB |
|---|---|---|
| Layer | 7 (HTTP/HTTPS, gRPC, WebSocket) | 4 (TCP, UDP, TLS) |
| Routing | Host, path, header, query, weighted target groups | Flow hashing to one target group per listener |
| Addressing | DNS name, dynamic IPs | Static IP or Elastic IP per AZ |
| Performance | Millisecond-level added latency | Ultra-low latency, millions of req/s, preserves source IP |
| Extras | WAF, Cognito/OIDC auth, fixed responses, Lambda targets | PrivateLink endpoint service, can front an ALB |
Both distribute across targets (instances, IPs, containers) in multiple AZs, perform health checks and integrate with Auto Scaling and ECS. Choose the ALB for web applications and microservice APIs where content-based routing, authentication offload or WAF matter. Choose the NLB for non-HTTP protocols, whitelisting by fixed IP, extreme throughput, or exposing a service to other VPCs through PrivateLink. The Gateway Load Balancer inserts third-party firewalls or inspection appliances transparently using GENEVE.
Interview takeaway: ALB understands requests, NLB understands connections; when you need both static IPs and HTTP routing, chain an NLB in front of an ALB target.
16In a real project using Amazon Web Services (AWS), how would you apply, test, or troubleshoot ELB ALB NLB?
Apply. An internet-facing ALB fronts the storefront: listener rules route /api/* to the ECS API target group, /static/* to a fixed redirect to CloudFront, and a header rule sends internal testers to a canary target group with 10% weight. WAF is attached for rate limiting, and the ALB terminates TLS with an ACM certificate. A separate internal NLB exposes the MQTT ingestion service on 8883 to partner VPCs through PrivateLink, which needs static IPs and client source addresses preserved for allow-listing.
Test. Target-group health checks are tuned and verified: the API’s /healthz returns 200 only when its dependencies are reachable, with a 10-second interval and 2/3 thresholds. Load tests watch TargetResponseTime, HTTPCode_Target_5XX_Count and RejectedConnectionCount; for the NLB, TCP_Target_Reset_Count and UnHealthyHostCount matter most. Deregistration delay (300 seconds default) is checked by deploying during load and confirming zero client errors.
Troubleshoot. 502 Bad Gateway from an ALB usually means the target closed the connection first (its keep-alive idle timeout is shorter than the ALB’s 60 seconds) or returned a malformed response; ALB access logs show elb_status_code versus target_status_code. 504 is a target timing out. For the NLB, connections hanging only from some clients point to missing security-group rules for the health checker or to cross-zone load balancing disabled while a zone has no healthy targets.
Important consideration: an ALB scales its own capacity over minutes, so sudden traffic spikes can be rejected; pre-warming via AWS Support or using an NLB is the answer for known flash events.
17Explain CloudFront CDN in the context of Amazon Web Services (AWS).
CloudFront is AWS’s content delivery network: hundreds of edge locations and regional edge caches that serve content close to users and terminate TLS there. A distribution maps path patterns (cache behaviors) to origins such as an S3 bucket, an ALB, a MediaPackage endpoint or any HTTP server.
How a request flows:
- The viewer connects to the nearest edge over HTTPS (HTTP/2 and HTTP/3 supported) using the distribution’s certificate from ACM.
- The edge computes a cache key from the URL plus whichever headers, cookies and query strings the cache policy includes; a hit is served immediately.
- On a miss the edge forwards to the origin, honoring an origin request policy, and caches the response for the TTL derived from
Cache-Controlor policy defaults. - Origin Access Control (OAC) lets a private S3 bucket be read only by the distribution, replacing the older Origin Access Identity.
The diagram shows the request path on a cache miss for a typical two-origin distribution.

Beyond caching, CloudFront provides DDoS absorption with Shield Standard, WAF integration, signed URLs and cookies for paid content, origin failover between two origins, and compute at the edge with CloudFront Functions (lightweight header rewrites) and Lambda@Edge (heavier logic such as A/B routing). Dynamic API traffic also benefits because the edge keeps persistent, optimised connections to the origin over the AWS backbone even when nothing is cacheable.
18In a real project using Amazon Web Services (AWS), how would you apply, test, or troubleshoot CloudFront CDN?
Apply. A retail site uses one distribution with two origins: a private S3 bucket behind OAC for the single-page app and images, and the ALB for /api/*. Static assets use the CachingOptimized policy with immutable, hashed filenames and a one-year TTL; the API behavior uses CachingDisabled plus an origin request policy that forwards Authorization and the needed headers. A CloudFront Function adds security headers and rewrites /product/123 to /index.html for client-side routing. Deployments upload new assets and then invalidate only /index.html, avoiding per-path invalidation charges.
Test. curl -I https://www.example.com/app.js must show x-cache: Hit from cloudfront on the second request and the expected cache-control. The CloudFront console’s cache statistics and the CacheHitRate metric should exceed roughly 90% for the static behavior. A direct request to the S3 bucket URL must return 403, proving OAC works. Lambda@Edge changes are tested with the staging distribution feature and continuous deployment policies before promoting.
Troubleshoot. A low hit rate is almost always a cache key that includes unnecessary cookies or query strings; standard logs (now deliverable to S3, CloudWatch Logs or Firehose) show x-edge-result-type per request. 403 from an S3 origin means the bucket policy does not grant the distribution’s service principal. Stale content after a release points to a missing invalidation or a long max-age on HTML. Origin 504s combined with high OriginLatency indicate the origin, not the edge.
Important consideration: cache policies and origin request policies are separate on purpose; forwarding a header to the origin without putting it in the cache key is how you keep personalisation and caching compatible.
19Explain RDS versus DynamoDB in the context of Amazon Web Services (AWS).
RDS is a managed relational database service running PostgreSQL, MySQL, MariaDB, Oracle, SQL Server and Db2, with Aurora as AWS’s cloud-native MySQL/PostgreSQL-compatible engine. DynamoDB is a fully managed, serverless key-value and document store.
| Aspect | RDS / Aurora | DynamoDB |
|---|---|---|
| Data model | Tables, joins, SQL, ACID across rows | Items in tables accessed by key; limited query patterns |
| Scaling | Vertical plus read replicas; Aurora Serverless v2 autoscaling | Horizontal and automatic; on-demand or provisioned capacity |
| Latency | Milliseconds, depends on instance and query plan | Single-digit ms at any scale; DAX for microseconds |
| Operations | Patching, Multi-AZ failover, backups managed; you tune schema and indexes | No servers; you design keys and indexes |
| Pricing | Per instance-hour plus storage and IOPS | Per request and GB, or capacity units |
| Fit | Complex queries, reporting, existing SQL apps | High-throughput, known access patterns, serverless apps |
The deciding question is whether access patterns are known up front. DynamoDB rewards designing the table around queries and punishes ad-hoc analytics; RDS tolerates evolving queries but requires capacity planning and connection management. Many systems use both: DynamoDB for the hot transactional path and Aurora or Redshift for reporting, kept in sync through DynamoDB Streams.
20In a real project using Amazon Web Services (AWS), how would you apply, test, or troubleshoot RDS versus DynamoDB?
Apply. In a ticketing platform, seat inventory and shopping carts go to DynamoDB: millions of reads per second during on-sale events, simple key lookups, conditional writes to prevent double-booking, and TTL to expire abandoned carts. Orders, invoices and finance reporting go to Aurora PostgreSQL because they need joins, constraints and ad-hoc SQL for analysts. DynamoDB Streams feed completed purchases into Aurora through a Lambda consumer, and RDS Proxy sits in front of Aurora so bursty Lambda functions do not exhaust connections.
Test. For DynamoDB I load-test with a traffic shape mirroring the on-sale spike and watch ConsumedReadCapacityUnits and ThrottledRequests per table and GSI, verifying on-demand mode absorbs it. For Aurora, pgbench plus the real query mix with EXPLAIN ANALYZE validates indexes, and a forced failover (aws rds failover-db-cluster) confirms the application reconnects within the RTO. Point-in-time recovery is rehearsed on both services into a scratch account.
Troubleshoot. DynamoDB ProvisionedThroughputExceededException with capacity to spare means a hot partition; CloudWatch Contributor Insights shows the offending keys. Aurora CPU at 100% with slow queries is diagnosed with Performance Insights (top SQL by wait event) and usually fixed by an index or by moving reads to a reader endpoint. “Too many connections” is solved by RDS Proxy rather than larger instances.
Important consideration: DynamoDB item size is capped at 400 KB and scans are expensive, so storing large documents or needing flexible reporting is a signal to choose the relational option.
21Explain DynamoDB partition keys in the context of Amazon Web Services (AWS).
Every DynamoDB item is located by its primary key, which is either a single partition key or a composite of partition key plus sort key. DynamoDB hashes the partition key to decide which physical partition stores the item, so the key distribution directly determines how evenly throughput is spread. Items sharing a partition key form an item collection stored together and ordered by sort key, enabling efficient Query operations such as “all orders for customer 42 in March”.
Why it matters:
- Each physical partition serves a bounded throughput (3,000 RCU and 1,000 WCU) and up to 10 GB; a few very popular keys create hot partitions that throttle even when the table has unused capacity. Adaptive capacity helps but cannot exceed per-partition limits.
- Good partition keys have high cardinality and uniform access:
customerId,orderId,deviceId. Poor ones includestatus,countryCodeor a date, which funnel traffic into a handful of partitions. - Write sharding appends a suffix (
2026-11-06#07) to spread time-series writes, and Global Secondary Indexes provide alternative partition keys for other access patterns. - Single-table design groups several entity types under one partition key (
CUST#42) with sort-key prefixes (ORDER#...,ADDR#...) so one query fetches a whole aggregate.
Interview takeaway: choose the partition key from the access patterns, not from the data model, and verify that the busiest access pattern spreads across many key values.
22In a real project using Amazon Web Services (AWS), how would you apply, test, or troubleshoot DynamoDB partition keys?
Apply. For an IoT telemetry pipeline ingesting readings from 200,000 devices, the table uses deviceId as partition key and timestamp as sort key, giving naturally even write distribution and efficient time-range queries per device. A dashboard needing “latest readings per site” cannot be served from that key, so a GSI with partition key siteId#yyyymmdd and sort key timestamp exists; the daily suffix prevents a large site from becoming a single hot index partition. Device metadata shares the table under DEVICE#<id> with sort key META, so one query returns metadata and recent readings.
Test. Before launch I replay a day of recorded traffic with a load generator and compare ConsumedWriteCapacityUnits against WriteThrottleEvents on both the table and the GSI, since GSI throttling back-pressures the base table. CloudWatch Contributor Insights for DynamoDB is enabled on the table to list the most-accessed keys; a healthy chart shows a flat distribution rather than a few dominant keys. Query cost is checked with ReturnConsumedCapacity: TOTAL in integration tests to catch accidental scans.
Troubleshoot. Throttling with low average utilisation is the hot-partition signature; Contributor Insights names the key, and the fix is write sharding or a different key. Large item collections (over 10 GB with a Local Secondary Index) fail writes with ItemCollectionSizeLimitExceededException, which forces a key redesign. Unexpectedly high read cost usually traces back to a Scan with a filter expression that should have been a Query on a GSI.
Important consideration: the partition key cannot be changed after table creation, so a migration means writing a new table and back-filling it.
23Explain Lambda cold starts and concurrency in the context of Amazon Web Services (AWS).
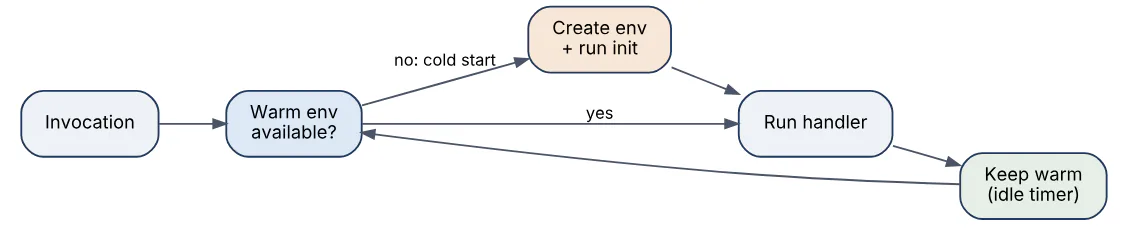
A cold start happens when Lambda must create a new execution environment: download the code or image, start the runtime, and run initialisation code outside the handler. It adds anywhere from under 100 ms for small Python or Node.js functions to several seconds for large Java or .NET applications or functions attached to a VPC with heavy frameworks. After the first invocation the environment is kept warm and reused for subsequent requests, so only a fraction of invocations pay the penalty, mostly after idle periods or during scale-out.
Concurrency is the number of environments running at once; each handles exactly one request at a time. The account has a regional pool (1,000 by default, raisable), and each function can set:
- Reserved concurrency, which caps a function and guarantees it that share of the pool, protecting downstream systems such as a database.
- Provisioned concurrency, which keeps a set number of environments initialised ahead of time so those invocations never cold start; it costs money while idle and can be scheduled with Application Auto Scaling.
Mitigations for cold starts include keeping deployment packages small, lazy-loading SDK clients, raising memory (which also raises CPU), and SnapStart, which snapshots an initialised environment and resumes from it; SnapStart supports Java 11+, Python 3.12+ and .NET 8+ runtimes. The diagram shows the lifecycle.
24In a real project using Amazon Web Services (AWS), how would you apply, test, or troubleshoot Lambda cold starts and concurrency?
Apply. In a checkout API built on API Gateway and Lambda, the latency-critical createOrder function gets provisioned concurrency of 20 during business hours via a scheduled scaling policy, and 5 overnight. The Java generateInvoice function uses SnapStart instead, since its traffic is bursty and a 4-second JVM start is unacceptable. The syncToERP function has reserved concurrency of 10 because the ERP accepts only a dozen connections. SDK clients and database connections are created outside the handler so warm invocations reuse them, and ARM (Graviton) architecture is chosen for cheaper, faster execution.
Test. CloudWatch Logs Insights over the REPORT lines separates cold from warm invocations:
filter @type = "REPORT"
| stats count(*) as total,
        sum(ispresent(@initDuration)) as coldStarts,
        pct(@duration, 99) as p99 by bin(5m)
Load tests from a cold account state measure how many cold starts a traffic ramp produces and whether provisioned concurrency absorbs them (ProvisionedConcurrencySpilloverInvocations should be zero). X-Ray traces show initialisation segments separately from handler time.
Troubleshoot. Rate exceeded or TooManyRequestsException means the account or reserved limit is hit; the Throttles metric per function identifies which. A function with reserved concurrency of zero is silently disabled, a common cause of “nothing is happening”. Rising @initDuration after a deployment usually means a dependency added to the package or a VPC attachment; trimming imports or using Lambda layers for shared code helps.
Important consideration: provisioned concurrency applies only to a published version or alias, never to $LATEST, so deployments must shift the alias or the warm pool is wasted.
25Explain API Gateway authentication in the context of Amazon Web Services (AWS).
API Gateway can authenticate every request before it reaches the backend, with different options depending on API type (REST, HTTP or WebSocket).
- IAM authorization requires callers to sign requests with SigV4 using AWS credentials; ideal for service-to-service calls and internal tooling, and it integrates with resource policies for cross-account access.
- Amazon Cognito user pool authorizer (REST APIs) validates the JWT issued by a user pool and exposes claims to the backend. HTTP APIs generalise this as a JWT authorizer that works with any OIDC or OAuth 2.0 issuer, checking issuer, audience and expiry natively.
- Lambda authorizers (formerly custom authorizers) run your code against the token or request parameters and return an IAM policy document plus context; results can be cached per token for up to an hour. They handle legacy tokens, API-key-plus-HMAC schemes or authorization lookups in a database.
- Mutual TLS on a custom domain verifies client certificates against a truststore in S3, common for B2B integrations.
- API keys with usage plans meter and throttle clients but are not an authentication mechanism and should be combined with one of the above.
Resource policies and WAF add IP allow-lists and request filtering in front of authentication. The usual production choice is Cognito or an external identity provider via JWT for end users, IAM for internal services, and a Lambda authorizer only when the token format forces custom logic.
26In a real project using Amazon Web Services (AWS), how would you apply, test, or troubleshoot API Gateway authentication?
Apply. A mobile banking back end uses an HTTP API with a JWT authorizer pointed at the Cognito user pool issuer and the app client ID as audience. Routes carry scopes (transfers/write) so the authorizer rejects tokens lacking them before Lambda runs. Partner banks call a separate REST API with mutual TLS plus IAM authorization through cross-account roles, and a resource policy limits sources to their VPC endpoints. Internal admin tools sign requests with SigV4 from their own roles. Nothing relies on API keys for identity; they exist only to attach usage plans for rate limits per partner.
Test. Contract tests call each route with no token, an expired token, a token from the wrong audience and a valid token, asserting 401, 401, 401 and 200 respectively. For the Lambda authorizer used on one legacy route, unit tests cover the policy document it emits, and the authorizer cache TTL is set to 300 seconds then verified by revoking a token and confirming it still works until expiry, which documents the expected behavior. aws apigatewayv2 get-authorizer output is checked in the pipeline against the expected issuer so a misconfigured environment is caught early.
Troubleshoot. 401 Unauthorized with message Unauthorized from a JWT authorizer typically means a wrong issuer URL or the token sent in a header the authorizer is not reading. 403 with Missing Authentication Token is misleading: it usually means the route or stage does not exist. Lambda authorizer failures surface as 500 or User is not authorized; enabling execution logging and checking the authorizer’s own CloudWatch log group reveals policy document typos.
Important consideration: authorizer caching keys on the token string, so a cached allow policy keeps working after revocation until the TTL expires; keep TTLs short where immediate revocation matters.
27Explain SQS visibility timeout and DLQ in the context of Amazon Web Services (AWS).
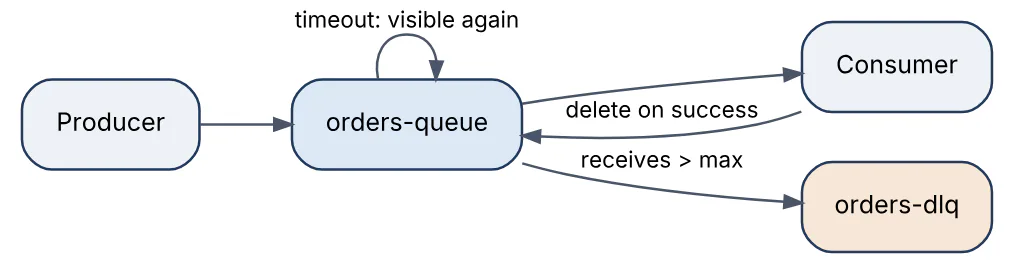
SQS delivers a message to a consumer without deleting it; the visibility timeout (default 30 seconds, maximum 12 hours) is the window during which that message is hidden from other consumers. If the consumer finishes and calls DeleteMessage within the window, the message is gone. If it crashes or exceeds the window, the message becomes visible again and another consumer receives it, which is how SQS achieves at-least-once delivery. Consumers doing long work call ChangeMessageVisibility to extend the window as a heartbeat.
A dead-letter queue (DLQ) is a second queue configured on the source queue through a redrive policy with maxReceiveCount. Each time a message is received its receive count increments; when it exceeds the threshold the message is moved to the DLQ instead of being retried forever. This isolates poison messages, preserves them for inspection, and keeps the main queue healthy. DLQ redrive lets you move messages back to the source queue after a fix.
A FIFO queue’s DLQ must also be FIFO, and the visibility timeout should exceed the consumer’s worst-case processing time plus a margin; otherwise duplicates appear even though nothing failed.
28In a real project using Amazon Web Services (AWS), how would you apply, test, or troubleshoot SQS visibility timeout and DLQ?
Apply. An order-fulfilment service consumes from a standard queue with a Lambda event source mapping. Processing takes up to 40 seconds, so the queue’s visibility timeout is 6 minutes, six times the Lambda timeout as AWS recommends when batching. maxReceiveCount is 3 and the DLQ has a 14-day retention. A CloudWatch alarm on ApproximateNumberOfMessagesVisible of the DLQ pages the on-call engineer when it rises above zero. Handlers are idempotent, keyed on the order ID in DynamoDB, because redelivery is expected behavior rather than an error.
Test. Integration tests publish a message whose payload forces an exception and assert it appears on the DLQ after exactly three attempts, with ApproximateReceiveCount attribute equal to 3. A second test sleeps past the visibility timeout without deleting and confirms a second receive, which validates the idempotency logic. Load tests check ApproximateAgeOfOldestMessage stays within the SLA as consumer concurrency scales, and the Lambda ReportBatchItemFailures response is exercised so one bad item does not fail a whole batch.
Troubleshoot. Duplicate side effects such as two shipping labels nearly always mean the visibility timeout is shorter than processing time; the fix is extending it or heartbeating with ChangeMessageVisibility. Messages piling up in the DLQ after a deployment indicate a deserialization change; inspecting a sample with receive-message and redriving with start-message-move-task after the fix restores them. An empty DLQ with messages silently vanishing points to a retention period shorter than the backlog age.
Important consideration: with Lambda, a batch of ten where one item fails is retried in full unless partial batch responses are enabled, which multiplies duplicates and DLQ noise.
29Explain SNS versus EventBridge in the context of Amazon Web Services (AWS).
Both are serverless publish/subscribe services that fan out messages to many consumers, but they target different integration styles.
| Aspect | SNS | EventBridge |
|---|---|---|
| Model | Topics with subscriptions | Event buses with rules that match and route |
| Filtering | Attribute-based, optional payload filtering | Rich content-based patterns on the full event body |
| Targets | SQS, Lambda, HTTP, email, SMS, mobile push, Firehose | 20+ AWS services, API destinations, other buses, cross-account |
| Sources | Your publishers only | Your apps, 200+ AWS services, SaaS partners, schedules |
| Throughput and latency | Very high, near-real-time, FIFO topics available | Lower per-bus limits, roughly half-second latency |
| Extras | Message delivery status, mobile messaging | Schema registry, archive and replay, Pipes, Scheduler |
The diagram contrasts the two fan-out shapes: a topic with subscriptions versus a bus with rules.
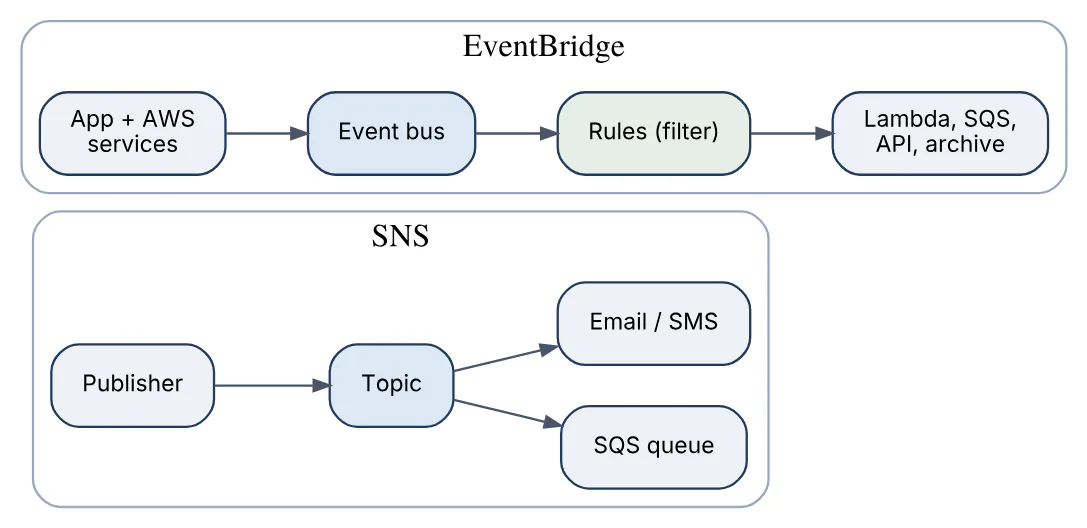
Choose SNS for high-volume fan-out where consumers are known (the classic topic feeding several SQS queues), for sending to people via SMS or email, or when ordering with FIFO topics is required. Choose EventBridge for an event-driven architecture where many teams publish domain events to a shared bus, consumers attach rules without the producer knowing, you need to react to AWS service events (an S3 object created, a Config change) or SaaS events, or you want archive and replay for recovery and testing. In practice the two combine: an EventBridge rule can target an SNS topic to reach human subscribers.
30In a real project using Amazon Web Services (AWS), how would you apply, test, or troubleshoot SNS versus EventBridge?
Apply. In a retail system the order service publishes OrderPlaced to a central EventBridge bus; the inventory, loyalty and analytics teams each own a rule matching detail-type and routing to their SQS queue or Lambda, and a catch-all rule archives everything for replay. The warehouse scanner fleet, by contrast, pushes 50,000 scans per minute to an SNS FIFO topic with two SQS FIFO subscribers, because strict ordering per pallet and high throughput matter more than rich filtering. Operational alerts from CloudWatch alarms flow to an SNS topic with email and PagerDuty HTTPS subscriptions.
Test. For EventBridge, aws events test-event-pattern runs against sample events in unit tests to prove each rule matches exactly what it should. End-to-end tests put an event with put-events, then poll the consumer queue; the FailedInvocations and TriggeredRules metrics confirm delivery. For SNS, subscription filter policies are tested by publishing messages with varied attributes and checking which queues receive them, and the FIFO deduplication window is verified by publishing the same deduplication ID twice.
Troubleshoot. An EventBridge rule that never fires is usually a pattern mismatch (detail fields nested wrongly or a string against a number) or a missing resource policy on the target; the rule’s DLQ and FailedInvocations show the latter. SNS messages not arriving in SQS typically mean the queue policy does not allow sns.amazonaws.com to SendMessage, visible as NumberOfNotificationsFailed. Raw message delivery turned off produces an unexpected JSON envelope that consumers fail to parse.
Important consideration: EventBridge events are capped at 256 KB and delivery is at-least-once, so consumers must be idempotent and large payloads belong in S3 with a reference in the event.
31Explain Step Functions workflows in the context of Amazon Web Services (AWS).
Step Functions is a serverless orchestrator that runs state machines defined in Amazon States Language (JSON or the newer JSONata-based syntax). Each state is a task (call a Lambda function or any of over 200 AWS service APIs directly), a choice, a parallel branch, a map over an array, a wait, or a pass/succeed/fail terminal. The service persists execution state between steps, so a workflow can run for up to a year, survive component failures, and resume exactly where it left off.
Core capabilities:
- Retry and Catch per state with exponential backoff, so each step’s failure handling is declared, not coded.
- Standard workflows are exactly-once, auditable and long-running; Express workflows are at-least-once, cheap, high-rate and limited to five minutes, suited to streaming and IoT.
- Distributed Map fans out to up to 10,000 parallel child executions over items in S3, replacing hand-rolled batch processing.
- Callback patterns (
.waitForTaskToken) pause until an external system, such as a human approval, posts a result. - The console shows each execution’s path and inputs/outputs, which makes debugging multi-step processes far easier than tracing Lambda chains through logs.
Typical uses are order sagas with compensation steps, ETL pipelines calling Glue and Athena, and approval workflows. The diagram shows a payment saga with a compensating refund.

32In a real project using Amazon Web Services (AWS), how would you apply, test, or troubleshoot Step Functions workflows?
Apply. A loan-application workflow is a Standard state machine: a Lambda validates the form, a direct DynamoDB PutItem integration records it, a Parallel state runs credit check and fraud scoring at once, a Choice state routes to auto-approval or to a .waitForTaskToken task that posts to an underwriter queue and waits up to five days for a human decision, and an SNS publish notifies the applicant. Retries are declared on every external call (three attempts, backoff rate 2), and a Catch on the whole flow routes to a RecordFailure state so no application is lost silently.
Test. Unit-level tests use the TestState API to execute single states with mocked input and assert outputs and chosen transitions. Whole-workflow tests run against Step Functions Local or a dev account with mocked service integrations defined in a mock configuration file, covering the happy path, the fraud-rejected path and the timeout path. Load tests on an Express variant check ExecutionsThrottled and the Lambda concurrency it drives. Definitions are linted in CI with the state machine validator in the SDK or cfn-lint rules.
Troubleshoot. States.TaskFailed with a Lambda error is read directly from the execution’s event history; the console’s graph view highlights the failed state with its input, which usually exposes a missing field or an ItemsPath / JSONPath mistake. States.Timeout on a callback task means the token was never returned, typically because the external worker lost it; storing the token with the work item fixes it. Execution history exceeding 25,000 events in long loops is solved by Distributed Map or by splitting into child executions.
Important consideration: Standard workflows bill per state transition, so a tight polling loop with a Wait state can cost more than the work it orchestrates; prefer callbacks or .sync integrations.
33Explain CloudWatch logs and metrics in the context of Amazon Web Services (AWS).
CloudWatch is the native observability service, and its two core data types serve different questions.
Metrics are time-series values identified by namespace, metric name and dimensions (for example AWS/EC2, CPUUtilization, InstanceId). AWS services publish them automatically at one- or five-minute resolution; applications publish custom metrics through PutMetricData, the CloudWatch agent, or the Embedded Metric Format, which extracts metrics from structured log lines without extra API calls. Metrics drive alarms, which evaluate statistics over periods and trigger SNS, Auto Scaling or EventBridge actions; composite alarms combine several conditions to reduce noise.
Logs are text or JSON events stored in log groups and streams with configurable retention (default: never expire, which is a common cost mistake). Lambda, ECS, API Gateway and the CloudWatch agent ship logs here. Logs Insights queries them with a purpose-built language; metric filters turn matching log lines into metrics (count of ERROR per minute) so alarms can fire on log content; subscription filters stream logs to Kinesis, Firehose, Lambda or OpenSearch.
Around these sit dashboards, anomaly detection, Synthetics canaries, Application Signals for service-level objectives, and X-Ray traces, giving the three pillars of logs, metrics and traces in one account-level view. For cost control, metrics are charged per custom metric and API call, logs per GB ingested and stored, so high-cardinality dimensions and verbose debug logging are the usual budget culprits.
34In a real project using Amazon Web Services (AWS), how would you apply, test, or troubleshoot CloudWatch logs and metrics?
Apply. For a microservice platform on ECS, every service logs structured JSON to its own log group with 30-day retention, and business metrics (OrdersCreated, PaymentLatency with a PaymentProvider dimension) are emitted via Embedded Metric Format so one log line yields both a searchable event and a metric. Alarms follow the SLO: a composite alarm fires only when 5xx ratio and p99 latency both breach, which pages via SNS to the on-call tool. Metric filters count "level":"ERROR" per service. Dashboards are built per service from a CDK construct so they stay consistent.
Test. Alarm wiring is verified with aws cloudwatch set-alarm-state --state-value ALARM to confirm the notification path end to end, and synthetic canaries exercise the public endpoints every minute from outside the VPC. Logs Insights queries used in runbooks are saved and reviewed, for example:
fields @timestamp, service, traceId, message
| filter level = "ERROR" and service = "payments"
| stats count() by bin(1m)
Load tests confirm custom metrics appear within the expected minute and that the EMF payloads stay under the per-event size limit.
Troubleshoot. A missing metric is usually a dimension mismatch between the alarm and the data (metrics with different dimension sets are different metrics). Alarms stuck in INSUFFICIENT_DATA need the TreatMissingData setting adjusted. Log bills jumping after a release point to debug logging or request-body logging; IncomingBytes by log group finds the source. Logs not appearing from ECS is nearly always a task role lacking logs:CreateLogStream / PutLogEvents or a log group that does not exist with awslogs-create-group off.
Important consideration: high-cardinality dimensions such as user ID or request ID explode custom-metric costs, so cardinality belongs in logs and traces, not metrics.
35Explain CloudTrail and auditing in the context of Amazon Web Services (AWS).
CloudTrail records API calls made in an account, whether from the console, CLI, SDKs or other AWS services, and is the authoritative source for “who did what, when, from where”. Each event captures the identity (including the assumed role and session), source IP, time, request parameters and response elements.
Key elements:
- Event history keeps 90 days of management events free of charge per Region, searchable in the console.
- A trail delivers events continuously to an S3 bucket (and optionally CloudWatch Logs) for long-term retention; an organization trail covers every account in AWS Organizations from the management or delegated administrator account.
- Management events are control-plane calls (
RunInstances,PutBucketPolicy); data events are high-volume object-level operations (S3GetObject, LambdaInvoke, DynamoDB item access) and are billed separately, so they are usually enabled selectively. - CloudTrail Lake stores events in a queryable data store for SQL analysis across accounts without building an Athena pipeline.
- Log file validation produces digest files with SHA-256 hashes so tampering with delivered logs is detectable.
- CloudTrail Insights flags unusual API call rates or error rates.
Auditing in practice layers CloudTrail with AWS Config (resource configuration history and compliance rules), Security Hub findings, GuardDuty (which consumes CloudTrail to detect threats) and Access Analyzer. Together they satisfy controls in SOC 2, ISO 27001 and PCI DSS for change tracking and access review, provided the trail bucket is protected with Object Lock and a restrictive policy.
36In a real project using Amazon Web Services (AWS), how would you apply, test, or troubleshoot CloudTrail and auditing?
Apply. In a regulated fintech landscape I enable one organization trail from a delegated security account, delivering to a dedicated log-archive account bucket with S3 Object Lock in compliance mode, SSE-KMS encryption and a bucket policy that allows only CloudTrail to write. Data events are turned on for the customer-data S3 buckets and the production DynamoDB tables only. Events also stream to CloudWatch Logs with metric filters for root login, IAM policy changes, security-group changes and StopLogging, each wired to an alarm. CloudTrail Lake holds a seven-year store for investigations, and AWS Config records every resource with conformance packs for the required framework.
Test. Each detective control is exercised: a test user creates a security group rule open to the world in a sandbox account and the alarm must fire within minutes; aws cloudtrail validate-logs runs weekly to prove digest integrity; a tabletop exercise has the security team answer “who changed bucket X last Tuesday” using a Lake query, timed against the incident-response target. Config rule evaluations are checked against intentionally non-compliant resources.
Troubleshoot. Missing events after an hour are usually the trail configured for one Region when it should be multi-Region, or a bucket policy blocking delivery (InsufficientS3BucketPolicyException). A noisy trail bill is almost always data events on a chatty bucket; advanced event selectors can exclude GetObject from a log bucket. Investigations that cannot identify a person behind an assumed role are fixed by enforcing sts:RoleSessionName to equal the user’s identity through the trust policy’s Condition.
Important consideration: CloudTrail delivers management events within roughly 15 minutes and is not real-time, so it is a forensic and detective control rather than a preventive one.
37Explain KMS and Secrets Manager in the context of Amazon Web Services (AWS).
AWS KMS (Key Management Service) creates and controls cryptographic keys. A KMS key never leaves the service’s HSM-backed boundary; callers ask KMS to encrypt, decrypt, sign or generate data keys, and every call is authorised by the key policy plus IAM and logged in CloudTrail. Most AWS services use envelope encryption: KMS issues a data key, the service encrypts the data locally with it, and stores the data key encrypted under the KMS key. Keys can be AWS-managed (aws/s3), customer-managed (your policy, rotation and aliases), or imported/external key store material. Automatic rotation keeps old versions for decrypting existing ciphertext.
Secrets Manager stores and rotates application secrets: database passwords, API keys, OAuth tokens. Each secret is a versioned, KMS-encrypted blob retrieved with GetSecretValue; rotation is performed by a Lambda function on a schedule, with managed rotation templates for RDS, Redshift and DocumentDB that update the database and the secret atomically. Secrets can be replicated to other Regions and shared cross-account via resource policies.
| Aspect | KMS | Secrets Manager |
|---|---|---|
| Stores | Keys (never exported in plaintext) | Secret values (returned to callers) |
| Primary operation | Encrypt / Decrypt / GenerateDataKey | GetSecretValue / RotateSecret |
| Rotation | Key material rotation, transparent | Secret value rotation via Lambda |
| Pricing | Per key per month plus per request | Per secret per month plus per API call |
Secrets Manager itself encrypts every secret with a KMS key, so the two combine: KMS protects data at rest everywhere, Secrets Manager handles the lifecycle of credentials that applications must read.
38In a real project using Amazon Web Services (AWS), how would you apply, test, or troubleshoot KMS and Secrets Manager?
Apply. A healthcare records service uses one customer-managed KMS key per data classification: the PHI key encrypts the S3 bucket, the Aurora cluster and the SQS queue, and its key policy grants kms:Decrypt only to the application role and kms:* administration only to a security role, with kms:ViaService conditions so the key works only through those services. Aurora credentials live in Secrets Manager with managed 30-day rotation using the alternating-users strategy; the application fetches them through the Secrets Manager caching client so a rotation does not cause a flood of API calls. Third-party API tokens are stored the same way and read at startup.
Test. Integration tests assert that a role outside the allow-list receives AccessDeniedException on Decrypt, and that writing an unencrypted object to the bucket is rejected by its policy. Rotation is rehearsed in staging: triggering rotate-secret and running the application’s connection test must succeed before and after, and the AWSPENDING version must be promoted to AWSCURRENT. CloudTrail is checked for Decrypt events from unexpected principals, and Config rules confirm every bucket, volume and database uses the expected key ARN.
Troubleshoot. KMS.AccessDeniedException while the IAM policy looks right means the key policy does not grant the principal; both must allow. Rotation stuck with the secret in AWSPENDING points to the rotation Lambda lacking network access to the database (a VPC function with no NAT or endpoint) or lacking secretsmanager:UpdateSecretVersionStage. Throttling on Decrypt under load is solved by caching data keys with the Encryption SDK or increasing the request quota.
Important consideration: deleting a KMS key destroys every piece of data encrypted under it, so deletion should go through the mandatory waiting period with a CloudWatch alarm on ScheduleKeyDeletion.
39Explain ECS versus EKS in the context of Amazon Web Services (AWS).
ECS (Elastic Container Service) is AWS’s own container orchestrator; EKS (Elastic Kubernetes Service) is managed upstream Kubernetes. Both run containers on EC2 instances or on Fargate serverless compute, pull images from ECR, and integrate with IAM, ALB and CloudWatch.
| Aspect | ECS | EKS |
|---|---|---|
| API and tooling | AWS-proprietary tasks, services, task definitions | Standard Kubernetes API, kubectl, Helm, operators |
| Control plane cost | Free; pay for compute only | Hourly fee per cluster plus compute |
| Operational load | Low: no cluster upgrades, few concepts | Version upgrades, add-ons, node groups, RBAC to manage |
| Ecosystem | AWS-native integrations (App Mesh retired, Service Connect) | Entire CNCF ecosystem: Argo, Istio, Prometheus, Karpenter |
| Portability | AWS only | Portable across clouds and on-premises |
| IAM model | Task roles map directly | IAM roles for service accounts or EKS Pod Identity |
Choose ECS when the team is AWS-centric, wants the simplest path to running containers (especially with Fargate), and does not need Kubernetes-specific tooling. Choose EKS when you already run Kubernetes elsewhere, need its ecosystem (custom resources, GitOps controllers, service meshes), or must stay portable. EKS Auto Mode now manages nodes, networking and core add-ons automatically, narrowing the operational gap, but Kubernetes still carries more concepts to learn and more upgrade cadence to keep up with.
Interview takeaway: the decision is about team skills and ecosystem needs, not raw capability; both scale to large production estates.
40In a real project using Amazon Web Services (AWS), how would you apply, test, or troubleshoot ECS versus EKS?
Apply. For a company whose dozen services are all AWS-native and whose team has no Kubernetes background, I would run ECS on Fargate: one cluster per environment, a service per microservice behind an ALB, ECS Service Connect for service discovery and retries, and task roles for least privilege. A sister team running a machine-learning platform with Kubeflow, Argo Workflows and GPU scheduling needs EKS; there I would use managed node groups for system workloads, Karpenter for GPU and Spot capacity, EKS Pod Identity for IAM, and Argo CD for GitOps deployment from the same repositories as the Helm charts.
Test. On ECS, deployment safety is validated with the circuit breaker and rollback option plus CloudWatch alarms attached to the deployment; a canary deployment through CodeDeploy’s blue/green is tested by shipping a build that fails its health check and confirming automatic rollback. On EKS, every cluster upgrade is rehearsed in a non-production cluster using kubectl deprecation checks (such as pluto or kubent) against the target API version, and pod disruption budgets are verified by draining a node under load. Both platforms run the same container contract tests and load tests, since the image is identical.
Troubleshoot. ECS tasks stopping repeatedly show the reason in describe-tasks (stoppedReason): CannotPullContainerError is networking or ECR permissions, OutOfMemoryError means the task memory limit is too low. On EKS, kubectl describe pod and kubectl get events expose ImagePullBackOff, CrashLoopBackOff or scheduling failures from taints and resource requests; IAM issues under Pod Identity surface as AccessDenied with the node role’s ARN in CloudTrail, which means the association is missing.
Important consideration: EKS clusters fall out of standard support roughly 14 months after a Kubernetes version ships and extended support bills a higher hourly rate, so upgrade cadence must be planned, whereas ECS has no version to upgrade.
41Explain CloudFormation versus Terraform in the context of Amazon Web Services (AWS).
Both are declarative infrastructure-as-code tools that compute a change set from the desired state and apply it, but they differ in scope, state handling and ecosystem.
| Aspect | CloudFormation | Terraform / OpenTofu |
|---|---|---|
| Vendor scope | AWS only (plus third-party via registry extensions) | Multi-cloud and SaaS through thousands of providers |
| Language | YAML/JSON templates; CDK compiles TypeScript, Python etc. to it | HCL; CDK for Terraform also available |
| State | Managed by AWS inside the service, no state file | State file you store, typically S3 with locking |
| Preview | Change sets | terraform plan |
| Drift and rollback | Drift detection, automatic rollback on failed stack update | Plan shows drift; no automatic rollback, partial applies possible |
| Modularity | Nested stacks, modules, StackSets for multi-account | Modules, workspaces, registry |
CloudFormation’s strengths are zero state management, native StackSets for organisation-wide deployment, and the AWS CDK, which gives real programming languages and high-level constructs with sensible defaults. Terraform’s strengths are consistency across clouds and SaaS providers (GitHub, Datadog, Okta in the same plan), a very fast plan loop, faster resource coverage, and a mature module ecosystem. Teams that are all-in on AWS and like typed languages often pick CDK; organisations managing heterogeneous estates almost always pick Terraform. Mixing is common: Terraform for accounts, networking and shared services, CDK for application stacks.
Interview takeaway: the real differentiators are state ownership, multi-cloud reach and rollback behavior, not the resource coverage both now have.
42In a real project using Amazon Web Services (AWS), how would you apply, test, or troubleshoot CloudFormation versus Terraform?
Apply. In a platform team I would use Terraform for the landing zone: accounts, Organizations SCPs, VPCs, Transit Gateway, IAM Identity Center and the Datadog and GitHub configuration that go with them, with remote state in a versioned S3 bucket (native S3 locking removes the DynamoDB table requirement in recent Terraform versions). Application teams ship their services with CDK in TypeScript, because constructs such as ApplicationLoadBalancedFargateService encode the platform’s defaults and the pipeline deploys per account through CloudFormation change sets. Both run from CI with OIDC roles; nobody applies from a laptop.
Test. Terraform modules have terraform validate, tflint and Checkov or tfsec in CI, plus terraform test or Terratest cases that create a module in a sandbox account and assert on outputs. CDK stacks have assertion tests against the synthesised template (Template.fromStack(...).hasResourceProperties(...)) and cdk-nag for policy checks, and cfn-lint catches template errors before a change set exists. Every pull request posts the plan or change set for review, and drift detection runs nightly on production stacks.
Troubleshoot. A CloudFormation stack stuck in UPDATE_ROLLBACK_FAILED is recovered with continue-update-rollback, skipping the resource that cannot roll back after fixing it manually. Resource replacement surprises are avoided by reading the change set’s Replacement: True flag. For Terraform, a stale lock after a crashed run is cleared with force-unlock, and resources created outside code are reconciled with import blocks or moved blocks when refactoring, which prevents a destructive plan. Provider version bumps are pinned and upgraded deliberately.
Important consideration: a mismatch between what the code says and what exists is the root of most incidents in either tool, so manual console changes in managed accounts must be blocked, not just discouraged.
43Explain multi-region disaster recovery in the context of Amazon Web Services (AWS).
Multi-region disaster recovery keeps a workload recoverable when an entire Region is impaired, which AZ redundancy cannot cover. Design starts from two business numbers: RTO (how long the service may be down) and RPO (how much data may be lost). AWS describes four strategies in increasing cost and decreasing RTO/RPO:
- Backup and restore: back up to another Region (AWS Backup cross-region copies, S3 Cross-Region Replication); rebuild from IaC on failure. RTO hours, RPO hours.
- Pilot light: data replicated continuously (Aurora Global Database, DynamoDB global tables), core infrastructure deployed but scaled to zero; scale up on failover. RTO tens of minutes, RPO seconds to minutes.
- Warm standby: a scaled-down but fully functional copy already serving a trickle of traffic; scale out on failover. RTO minutes.
- Multi-site active/active: both Regions serve traffic; Route 53 or Global Accelerator shifts users away from the failed Region. RTO near zero, RPO near zero, but it demands conflict handling for writes.
The diagram shows a warm-standby topology with database replication and DNS failover.
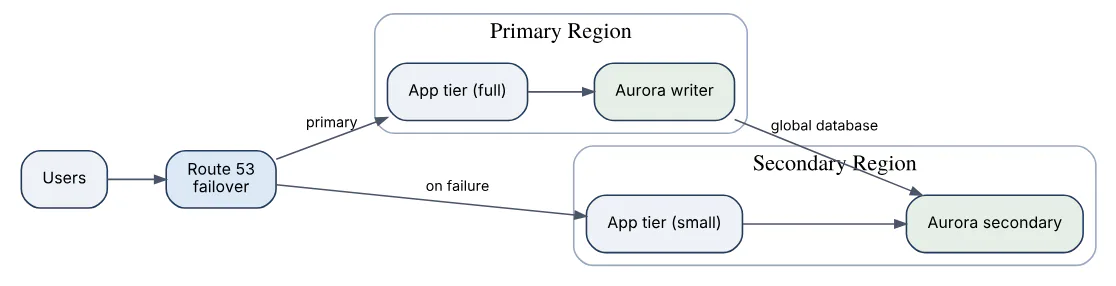
Supporting services include Elastic Disaster Recovery for servers, Route 53 Application Recovery Controller for safe, decoupled failover, and S3 Multi-Region Access Points.
44In a real project using Amazon Web Services (AWS), how would you apply, test, or troubleshoot multi-region disaster recovery?
Apply. For a payments gateway with a 15-minute RTO and near-zero RPO I would run warm standby: eu-west-1 primary, eu-central-1 secondary, both deployed from the same Terraform with Region as a variable. Aurora Global Database replicates with typical sub-second lag, DynamoDB global tables hold sessions, S3 buckets replicate both ways, and ECR images and Secrets Manager secrets are replicated so the secondary can start without the primary. Route 53 Application Recovery Controller routing controls decide which Region receives traffic; the secondary runs at 20% capacity with scaling policies ready. Deployment pipelines always release to the secondary first.
Test. A quarterly game day fails over the whole stack: an operator flips the routing control, Aurora’s managed planned failover promotes the secondary (unplanned failover is also rehearsed), and scaling is observed until the secondary serves full production load. Measured RTO and RPO (from AuroraGlobalDBReplicationLag and reconciliation of a test ledger) are compared with targets and documented. Between game days, Fault Injection Service experiments and Resilience Hub assessments check that the architecture still meets its policy after every infrastructure change.
Troubleshoot. Failover that technically succeeds but leaves the application broken usually reveals hidden single-Region dependencies: a KMS key without a multi-Region replica, a Lambda calling a hard-coded primary endpoint, a certificate only issued in one Region. Each is found during game days and fixed in code. Replication lag spikes before failover increase data loss; alarms on lag plus write throttling in the application keep RPO honest. Split-brain after an unplanned promotion is prevented by never allowing both Regions to accept writes at once, enforced through the routing control’s safety rules.
Important consideration: a DR Region that is never exercised is a liability, not a plan; quotas, AMIs and IAM in the secondary drift unless the pipeline treats it as a first-class target.
45Explain cost optimization reserved savings plans in the context of Amazon Web Services (AWS).
Reserved Instances and Savings Plans are commitment discounts: in exchange for promising one or three years of usage, AWS charges well below On-Demand rates, up to about 72% for the longest, fully prepaid terms.
| Model | What you commit to | Flexibility |
|---|---|---|
| Standard Reserved Instance | Specific instance family, Region, OS, tenancy (size-flexible for Linux) | Lowest price, can be sold on the RI Marketplace |
| Convertible Reserved Instance | Same, but exchangeable for other families | Smaller discount, more adaptable |
| Compute Savings Plan | Dollars per hour of compute spend | Any EC2 family, size, Region, OS; also Fargate and Lambda |
| EC2 Instance Savings Plan | Dollars per hour within one family in one Region | Higher discount than Compute, less flexibility |
| Database/other reservations | RDS, ElastiCache, OpenSearch, Redshift, DynamoDB reserved capacity | Service-specific |
All offer no-upfront, partial-upfront and all-upfront payment, with more prepayment buying a larger discount. Savings Plans apply automatically to matching usage, starting with the highest discount, and anything above the commitment is billed On-Demand, so the right approach is to cover the stable baseline (typically 60–80% of steady usage) and leave bursts to On-Demand or Spot. Cost Explorer’s recommendations analyse recent usage to suggest an hourly commitment, and the coverage and utilisation reports show whether existing commitments are used. Commitments complement, rather than replace, right-sizing and turning off idle resources: a reservation on an oversized instance locks in the waste.
46In a real project using Amazon Web Services (AWS), how would you apply, test, or troubleshoot cost optimization reserved savings plans?
Apply. For an organisation with twenty accounts, I would centralise purchasing in the management or a dedicated billing account so discounts float across the organisation. Steps in order: tag everything with CostCenter and Environment, right-size with Compute Optimizer and remove idle resources first, then buy a Compute Savings Plan for roughly 70% of the trailing 30-day minimum compute spend on a one-year no-upfront term, add EC2 Instance Savings Plans for the stable r7g database fleet where the extra discount is worth the lock-in, and RDS reserved instances for Aurora. Purchases are staggered monthly rather than in one block, so renewals can track changes in usage.
Test. Before buying, Cost Explorer’s recommendation is cross-checked against the next quarter’s roadmap (a planned migration to Graviton or to Fargate would change what Compute plans cover but would strand an EC2 Instance plan). After purchase, the Savings Plans utilisation report must show above 95% and the coverage report should rise to the target; an AWS Budgets alert on utilisation dropping below 90% catches decommissioned workloads early. Monthly, the Cost and Usage Report feeds a dashboard that shows effective hourly rate per account to prove the savings to finance.
Troubleshoot. Low utilisation means the commitment exceeds usage: the fix is growing matching workloads into it or, for RIs, selling on the Marketplace or exchanging Convertibles. Coverage that stays low despite purchases usually points to spend in a Region or service the plan does not cover, or to accounts excluded from discount sharing in Billing preferences. Unexpected On-Demand charges after an instance family change are the classic EC2 Instance Savings Plan trap.
Important consideration: commitments are a bet on a stable baseline, so purchase after architectural changes settle, never before a migration.
47Explain serverless design patterns in the context of Amazon Web Services (AWS).
Serverless design patterns are recurring ways of composing managed, pay-per-use services (Lambda, API Gateway, DynamoDB, SQS, SNS, EventBridge, Step Functions, S3) so that scaling, availability and failure handling come from the platform rather than custom servers.
Patterns that come up most:
- Synchronous API: API Gateway to Lambda to DynamoDB for request/response with authentication at the edge; for a serverless web application pair it with S3 plus CloudFront for the front end.
- Queue-based load levelling: producers write to SQS and Lambda consumers drain at a controlled rate, so bursts never overwhelm a downstream database; the DLQ catches poison messages.
- Fan-out: an SNS topic or EventBridge bus delivers one event to many independent consumers, decoupling teams and letting new subscribers attach without touching the producer.
- Event sourcing and CDC: DynamoDB Streams or Kinesis feed Lambda to build read models, search indexes or audit trails from change events.
- Orchestration versus choreography: Step Functions coordinates multi-step transactions with retries and compensation (saga), while choreography lets services react to each other’s events; most systems mix both.
- Storage-first: API Gateway writes directly to SQS, DynamoDB or EventBridge through service integrations, so a request is durably captured before any code runs.
- Scheduled and reactive jobs: EventBridge Scheduler triggers batch work; S3 event notifications trigger processing when files arrive.
The diagram combines several of these patterns in one ingestion pipeline.

Cross-cutting principles are idempotent handlers (every asynchronous service is at-least-once), small single-purpose functions, state in managed stores rather than in the function, and observability through structured logs, X-Ray and Lambda Powertools. The trade-offs are cold-start latency, per-invocation cost at very high constant throughput, and vendor-specific integrations that are harder to port.
48In a real project using Amazon Web Services (AWS), how would you apply, test, or troubleshoot serverless design patterns?
Apply. For a document-ingestion product, uploads go to S3 via pre-signed URLs; an S3 event lands on an SQS queue (queue-based load levelling) that a Lambda consumes to extract text with Textract; completion events go on an EventBridge bus and fan out to indexing, billing and notification consumers; a Step Functions Standard workflow orchestrates the long-running review path with human approval. The public API is HTTP API to Lambda with a JWT authorizer, and the storage-first pattern writes every submission to DynamoDB directly from API Gateway before any processing. Lambda Powertools provides idempotency (keyed on the document ID), structured logging and tracing across all functions.
Test. Unit tests use the Powertools event classes and mocked SDK clients; integration tests deploy an ephemeral stack per pull request with CDK or SAM and run against real services, because emulators diverge from AWS behavior. Contract tests publish sample events through put-events and assert downstream side effects. Failure injection is explicit: a test uploads a corrupt PDF and asserts it reaches the DLQ after three attempts with the original payload intact. Load tests confirm the queue absorbs a burst of 10,000 uploads while the Textract rate limit is respected via reserved concurrency.
Troubleshoot. Duplicate invoices after a retry storm expose a non-idempotent handler; the idempotency table shows the missing key. Events disappearing between services are found with X-Ray’s service map, which highlights the hop with errors, and with EventBridge’s rule-level FailedInvocations. Lambda throttling from an aggressive S3 event spike is dampened by the SQS buffer and maximumConcurrency on the event source mapping. Cost surprises usually trace back to a Step Functions polling loop or a function with memory far beyond its needs; Lambda Power Tuning picks the right size.
Important consideration: serverless shifts complexity into the integration layer, so the architecture must be visible as a whole (X-Ray, Application Signals) or distributed failures become very hard to reason about.
49Explain Well-Architected reliability in the context of Amazon Web Services (AWS).
The Reliability pillar of the AWS Well-Architected Framework defines reliability as a workload’s ability to perform its intended function correctly and consistently when expected, including recovering from failures and meeting demand. It is organised into four areas with design principles and best-practice questions.
- Foundations: manage service quotas and limits across accounts and Regions, and design the network topology (IP space, connectivity, redundancy) so it cannot be exhausted or become a single point of failure.
- Workload architecture: build a service-oriented or microservice design with well-defined APIs, and implement distributed-system practices such as idempotency, timeouts, retries with exponential backoff and jitter, circuit breakers, graceful degradation and throttling to protect downstream dependencies.
- Change management: monitor resources and respond automatically (alarms, Auto Scaling), deploy changes with immutable infrastructure and automated rollback, and use runbooks and playbooks so operational actions are repeatable.
- Failure management: back up data and test restores, use fault isolation (AZs, Regions, cell-based architecture), design for self-healing, define RTO and RPO and choose a matching DR strategy, and test reliability through chaos engineering and game days.
Design principles that recur across the pillar are automatically recover from failure, test recovery procedures, scale horizontally to increase aggregate availability, stop guessing capacity, and manage change through automation. Tools that support it include the Well-Architected Tool for reviews, Resilience Hub to assess against RTO/RPO policies, Fault Injection Service for experiments, Service Quotas, and CloudWatch with Application Signals for SLO tracking.
Interview takeaway: reliability in the framework is a measurable, tested property with defined RTO/RPO and availability targets, not an aspiration delivered by redundancy alone.
50In a real project using Amazon Web Services (AWS), how would you apply, test, or troubleshoot Well-Architected reliability?
Apply. Taking an online booking platform through a reliability review, I would first set targets: 99.95% availability for search, 99.99% for payment confirmation, RTO 30 minutes, RPO 5 minutes. Foundations: Service Quotas alarms on EC2 vCPU, Lambda concurrency and ENI counts, and IPAM-planned CIDRs. Architecture: every outbound call gets a timeout, bounded retries with jitter and a circuit breaker; the payment path degrades to “booking held, confirmation by email” if the provider is slow. Change management: blue/green ECS deployments gated by CloudWatch alarms, with automatic rollback. Failure management: Multi-AZ everything, AWS Backup plans with cross-Region copies, and a pilot-light secondary Region.
Test. Resilience Hub assesses the application against the RTO/RPO policy after each deployment and fails the pipeline if the estimate regresses. Fault Injection Service experiments run monthly: AZ network disruption, RDS failover, Lambda latency injection and API throttling, each with CloudWatch alarms as stop conditions. Backup restores are executed, not assumed, into an isolated account and compared with production row counts. Canary deployments carry synthetic traffic so a regression is caught before real users notice.
Troubleshoot. Recurring incidents are run through a correction-of-error review and mapped back to the pillar question they violate: a quota exhaustion incident becomes a new quota alarm plus a raised limit; a cascading failure from a slow dependency becomes a tighter timeout and bulkhead; a failed restore exposes an untested backup plan. The Well-Architected Tool records each high-risk issue with an owner and a milestone so the review has follow-through.
Important consideration: every redundancy mechanism, from Multi-AZ failover to a DR Region, is unproven until it has been exercised under realistic load, so the budget for game days is part of the reliability design, not an optional extra.
Answers tailored to your resume and job description
Add your resume and the job description in CrackItX's Settings. When the interviewer asks a Amazon Web Services (AWS) question, Claude suggests an answer using your real projects and the role's requirements, in real time.
See pricing →