Top 80 Azure DevOps
interview questions
Pipelines, YAML, repos, artifacts, environments and release gates. Open a question to read the answer.
01Explain Azure DevOps organizations projects in the context of Azure DevOps.
An organization is the top-level tenant in Azure DevOps Services: it has its own URL (https://dev.azure.com/{org}), a billing relationship with an Azure subscription, a link to one Microsoft Entra ID tenant, and organization-wide settings such as agent pools, extensions, auditing and security policies. A project lives inside an organization and is the unit that actually holds work: repositories, pipelines, boards, artifact feeds, test plans, wikis, and their permissions.
- One organization can hold many projects; a project cannot span organizations.
- Agent pools, deployment pools, billing and Entra ID are organization scope; service connections, variable groups, environments and feeds are project scope (feeds and some pools can be shared across projects).
- Projects use a process (Agile, Scrum, Basic, CMMI or an inherited custom process) that defines work item types and states.
- Security is layered: organization groups such as Project Collection Administrators, then project groups such as Contributors and Readers, then object-level ACLs on repos, branches, pipelines and areas.
The practical design choice is one project per product line with team-level isolation (teams, area paths, iterations) rather than one project per microservice, because cross-project linking, boards roll-ups and pipeline resource sharing are all easier inside a single project.
02In a real project using Azure DevOps, how would you apply, test, or troubleshoot Azure DevOps organizations projects?
Apply. For a retail platform I would create one organization bound to the company Entra tenant and a single Commerce project, then model each domain (catalog, checkout, payments) as a team with its own area path, iteration cadence and repositories. Shared infrastructure gets its own project only where legally separate audit or billing is required. Entra groups are mapped to project groups so joiners and leavers are handled by identity management, not by hand.
Test. Before onboarding, I verify access with a test user per role: a Reader cannot push, a Contributor cannot edit pipeline permissions, and only the release group can approve production environments. I also run a pipeline that consumes a cross-project feed and a pipeline resource to confirm scoping works, and check that the project-level “Limit job authorization scope to current project” setting is on.
Troubleshoot. The common failures are “TF401019 repository not found” or a pipeline unable to see a resource in another project; the fix is usually the job authorization scope setting or missing permissions for the project build service identity. Users who “cannot see the organization” are typically members of a guest tenant without Entra conditional-access satisfied, visible in Organization settings, Users.
One trap: a project cannot be moved between organizations without a migration tool, so the organization boundary should be chosen for compliance and billing, not convenience.
03Explain Azure Repos branching in the context of Azure DevOps.
Azure Repos hosts standard Git repositories, so branching is plain Git: lightweight pointers to commits, created with git checkout -b feature/x or from the web UI, Boards (branch from a work item) or the REST API. What Azure Repos adds on top is server-side control of branches.
- Branch policies on protected branches (usually
mainandrelease/*) enforce reviewers, linked work items, comment resolution and build validation, which forces changes through pull requests. - Branch permissions such as Contribute, Force Push and Create Branch can be set per branch or by folder pattern (
feature/*), so developers can create feature branches freely while only the release manager createsrelease/*. - Branch folders (
users/alice/spike) are just naming conventions, but the UI groups them and permissions can target them. - A repository has a default branch that pull requests target by default and that
triggerblocks in YAML use whenbranchesis omitted. - Locking a branch blocks all pushes, handy during a release freeze.
The diagram shows how branch types and permissions steer every change through a pull request into protected branches.

A repository is also where cross-repo policies apply: a project-level policy can require reviewers on every repository’s default branch at once. Branch naming is tied into pipeline triggers (refs/heads/release/*) and into Boards automation, so a consistent convention is a prerequisite for the rest of the toolchain.
04In a real project using Azure DevOps, how would you apply, test, or troubleshoot Azure Repos branching?
Apply. On an order-management service I would protect main with policies, allow feature/* and bugfix/* to be created by any Contributor, and restrict release/* and hotfix/* creation to the release group through folder-scoped permissions. Branches are created from the Boards work item so the link is automatic, and the pipeline uses trigger: branches: include: [main, release/*] so feature branches only build through PR validation.
Test. I validate the permission model with a non-privileged account: attempting git push origin release/1.4 should fail with TF401027, while pushing a feature branch succeeds. A dry-run PR into main confirms the policies fire and the build validation pipeline is queued.
Troubleshoot. Typical symptoms are a feature branch “disappearing” (someone enabled “delete source branch after merge” and the local branch still points at a deleted remote; git fetch --prune fixes the view), a force push rejected on main (intended: Force Push is denied), and pipeline triggers not firing on a new branch (the trigger include list or batch setting, or a YAML file that does not exist on that branch yet). Branch comparison in the web UI and git log --oneline main..release/1.4 show what has not been merged back.
The common mistake is letting long-lived branches accumulate without a cleanup rule; stale branches make the branch picker and policy pages slow and noisy, so I schedule a pipeline that deletes merged branches older than 30 days.
05Explain Git pull requests policies in the context of Azure DevOps.
Pull request (PR) policies are branch policies that Azure Repos enforces before a PR can complete into a protected branch. Once any policy exists on a branch, direct pushes to it are blocked and every change must go through a PR.
| Policy | What it enforces |
|---|---|
| Minimum number of reviewers | N approvals, optionally blocking the author’s own vote |
| Check for linked work items | Traceability to a Boards item |
| Check for comment resolution | All comments resolved or won’t fix |
| Limit merge types | Squash, rebase, no fast-forward |
| Build validation | A pipeline must succeed on the merge commit |
| Status checks | External service (SonarQube, licence scan) posts a status |
| Automatically included reviewers | Code owners by path, required or optional |
The diagram shows a pull request passing through the policy gate before it can complete into the protected branch.
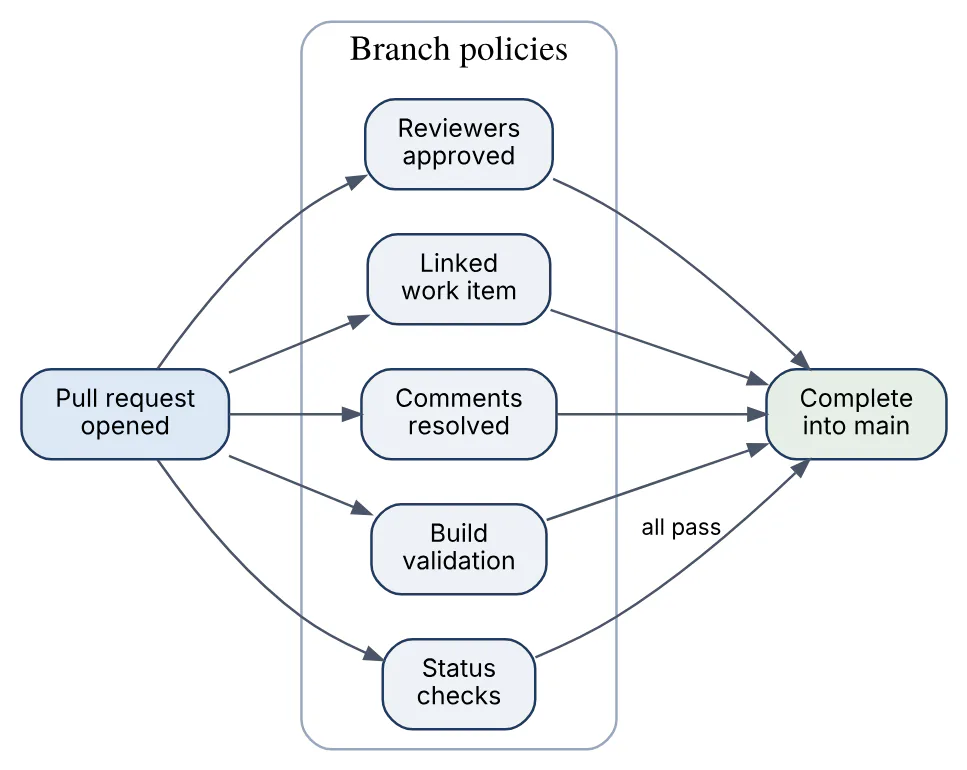
Policies can be required or optional, and a user with the “Bypass policies when completing pull requests” permission can override them (audited). Build validation runs against a temporary merge of source and target, so it tests what main will look like after the merge rather than the feature branch alone. The auto-complete option completes the PR as soon as all policies pass, and reviewer votes can be reset when new commits arrive. Policies live per branch or per folder pattern and can also be defined at project level across repositories.
06In a real project using Azure DevOps, how would you apply, test, or troubleshoot Git pull requests policies?
Apply. For a payments API in regulated scope, main gets two reviewers with the author excluded, a required linked work item, comment resolution, squash-only merges, and a build validation pipeline that runs unit tests and SAST and expires after 12 hours. The src/Payments.Core/** path adds the domain team as automatically included required reviewers. A status policy waits for the SonarQube quality gate.
Test. I open a PR from a throwaway branch and check each policy appears in the Overview panel, that the validation build queues on the merge commit (refs/pull/123/merge), and that pushing a new commit resets approvals. A deliberately failing test confirms the build policy blocks completion, and I confirm that a non-admin cannot see the bypass option.
Troubleshoot. When a PR is “stuck” the Policies panel says exactly which one is pending. Build validation that never starts is usually a pipeline whose YAML trigger includes pr: none combined with the policy pointing at the wrong pipeline, or the pipeline lacks permission on the repo. Status checks stuck at “waiting” mean the external tool never posted the status for that genre/name; the PR Statuses REST endpoint shows what was received. Reviewer policies that nobody can satisfy happen when a required group has lost membership.
The main cost is latency: a 40-minute validation build on every push makes developers batch commits, so I keep validation under 10 minutes and move slow suites to the main CI run.
07Explain Azure Boards backlogs sprints in the context of Azure DevOps.
Azure Boards is the planning service. A backlog is an ordered list of work items at one hierarchy level: Epics, Features, and the requirements level (User Stories in Agile, Product Backlog Items in Scrum, Issues in Basic). Tasks sit beneath requirements and appear on the sprint taskboard rather than the product backlog.
Sprints are iteration paths: date-bounded nodes in the project’s iteration tree that each team subscribes to. Assigning a work item an iteration path puts it in that sprint. The sprint backlog view adds capacity planning (hours per person per day, days off), a burndown chart, and the taskboard where tasks move across states.
- Area paths define which team owns it; iteration paths define when it is planned.
- Backlog levels, columns and the board’s swimlanes are per team and configurable in team settings.
- Forecasting uses a team velocity to draw the line showing how many sprints the backlog will take.
- Delivery Plans show several teams’ sprints on one calendar.
- Work item states map to board columns; a Kanban board and a sprint board can both reflect the same items.
The diagram shows the work item hierarchy and how each requirement is tied to a team and a sprint.
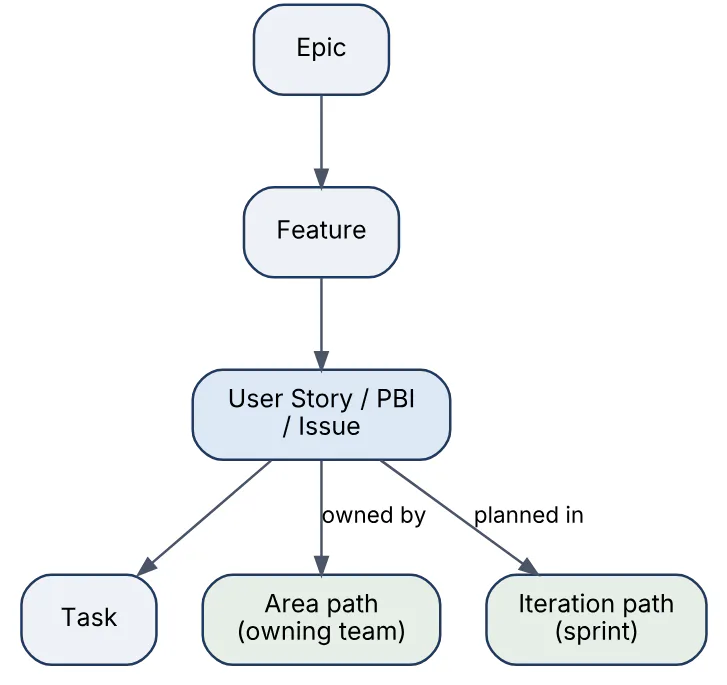
Choosing a process template (Scrum versus Agile) mostly changes naming and the default state model; the backlog and sprint mechanics are identical.
08In a real project using Azure DevOps, how would you apply, test, or troubleshoot Azure Boards backlogs sprints?
Apply. For three teams building a logistics platform I would create one shared iteration tree (Logistics\2026\Sprint 12, two-week cadence) so sprints line up for a joint review, and separate area paths per team. Epics and Features are owned by product management at the portfolio level; each team pulls Stories into its sprint during planning, splits them into Tasks with remaining-hours estimates, and uses capacity to catch over-commitment. Branches and PRs are linked to the Story so the board shows development status inline.
Test. “Testing” a Boards configuration means validating the process: a dry-run sprint where I check the burndown updates when Remaining Work changes, the velocity chart populates after a sprint closes, and the Kanban columns’ state mappings do not strand items (an item in “Ready for Test” must map to some state). I also verify team iteration subscriptions, because an unsubscribed sprint simply does not appear.
Troubleshoot. Items missing from a sprint backlog nearly always have the right iteration but the wrong area path, or the team has not selected that iteration. A flat burndown means tasks lack Remaining Work values. Items shown twice on a Kanban board point at a parent-child mismatch across backlog levels. The query editor with “Iteration Path = @CurrentIteration” is the fastest way to see what the board is actually counting.
The usual mistake is over-engineering the hierarchy; four levels and dozens of custom fields slow teams down more than they inform anyone.
09Explain work items links and queries in the context of Azure DevOps.
Work item links are typed relationships between work items and to artifacts. Hierarchy links (Parent/Child) build the Epic, Feature, Story, Task tree; dependency links (Predecessor/Successor) express ordering; Related is untyped; Tested By / Tests connect requirements to test cases; and artifact links join an item to a commit, branch, pull request, build or GitHub issue. Links are what make traceability and roll-up (effort, remaining work, completed percentages) possible.
Queries are saved searches written in Work Item Query Language (WIQL) through the query editor or the REST API. Three query shapes exist:
- Flat list of items matching field clauses (
State = Active AND [Assigned To] = @Me). - Work items and direct links, which filters by a link type to a related item.
- Tree of work items, which returns parents with their children using hierarchy links.
Macros such as @Me, @Today - 7, @CurrentIteration and @Project keep queries portable between teams. Queries live in My Queries (private) or Shared Queries (permission-controlled) and feed dashboard widgets, charts, Excel round-trips and alerts. A query can be exported as a WIQL snippet or called via POST _apis/wit/wiql, which is how automation such as “notify owners of blocked items” is usually built.
10In a real project using Azure DevOps, how would you apply, test, or troubleshoot work items links and queries?
Apply. In a banking programme I would standardise that every Story has a parent Feature, every PR links to a Story through the #1234 convention or the branch created from the item, and test cases link back with Tests/Tested By. On that foundation I build a Shared Queries folder: a tree query for sprint review, a direct-links query “Stories without test coverage” using Tested By with “does not have links”, and a flat query for items untouched for 14 days ([Changed Date] < @Today - 14). Dashboards chart the results per team.
Test. I verify queries against known fixtures: create a Story without a parent and confirm the orphan query returns it, then link it and confirm it disappears. For WIQL used by automation I run it through the REST API in a non-production project and compare counts with the UI, because clause precedence and @CurrentIteration team context differ between the two.
Troubleshoot. A query that returns nothing in a tree view usually filters the child level with a clause that also excludes the parents; moving the clause to the right side of the tree query fixes it. Roll-up columns show blanks when children use a different effort field than the parent expects. Broken traceability on PRs typically traces to developers mentioning IDs in the description rather than linking, which the Boards extension does not count.
A consideration: every link type is a query dimension, so keeping to a few consistently used types beats rich but inconsistent modelling.
11Explain YAML pipelines structure in the context of Azure DevOps.
A YAML pipeline is a file (conventionally azure-pipelines.yml) stored in the repository and versioned with the code. Its top-level keys define the whole run:
triggerandpr: CI and pull-request triggers (ornone).pool: where jobs run, for examplevmImage: ubuntu-latestorname: linux-pool.variables: inline values orgroup:references to variable groups.resources: other repositories, pipelines, containers and packages the pipeline can consume.stages→jobs→steps: the execution hierarchy. A simple pipeline can skipstagesand declarejobsor evenstepsdirectly.parametersfor runtime inputs and template typing.extendsto inherit from a governed template.
trigger:
  branches:
    include: [main]
pool:
  vmImage: ubuntu-latest
variables:
  buildConfiguration: Release
stages:
- stage: Build
  jobs:
  - job: Compile
    steps:
    - task: UseDotNet@2
      inputs: { version: '8.x' }
    - script: dotnet build -c $(buildConfiguration)
      displayName: Build solution
    - publish: $(Build.ArtifactStagingDirectory)
      artifact: drop
Expressions appear in three flavours: ${{ }} compile-time template expressions, $[ ] runtime expressions evaluated per job, and $( ) macro substitution inside task inputs. Understanding when each is resolved is the key to conditions, variable passing and templates.
12In a real project using Azure DevOps, how would you apply, test, or troubleshoot YAML pipelines structure?
Apply. For an inventory microservice I keep azure-pipelines.yml minimal: triggers, a resources: repositories reference to a shared pipeline-templates repo, and an extends to its service.yml template with parameters for the project path and target environments. Build, test, scan and deploy logic lives in the template, so the service file is ten lines and reviewable by anyone. Variables that differ per environment are in variable groups named inventory-dev, inventory-prod.
Test. Before merging a pipeline change I use the editor’s Validate action and the “Download full YAML” option, which expands templates and surfaces compile-time errors without a run. I then run with -stage Build only through “Run pipeline, stages to run” and inspect the expanded YAML in the run’s View YAML. For template expressions I add a temporary - script: echo $ {{ parameters.serviceName }} step; it is the quickest way to see what the compiler produced.
Troubleshoot. The most frequent errors are indentation (a steps key appearing under stage instead of job), using $( ) in a condition where $[ ] or variables['x'] is required, and ${{ }} referencing a variable set at runtime, which resolves to empty because compile time has already passed. “A sequence was not expected” means a list where a mapping was required. Pipeline logs with system.debug: true show every variable as resolved.
The consideration is that YAML is compiled once per run, so a parameter cannot be changed by an earlier stage; runtime data must flow through output variables.
13Explain stages jobs steps in the context of Azure DevOps.
Stages, jobs and steps are the three levels of the Azure Pipelines execution model.
- A stage is a logical boundary (Build, Test, Deploy to Staging, Deploy to Production). Stages run sequentially by default, can be ordered with
dependsOn, gated withcondition, and are where approvals and checks attach through environments. Each stage can have its own agent pool. - A job is a unit of work scheduled onto one agent (or run on the server for agentless tasks). Jobs within a stage run in parallel when parallel-job capacity allows and have no dependency, each on a fresh workspace. A deployment job is a special job type that targets an environment and supports
runOnce,rollingandcanarystrategies. - A step is the smallest unit: a
script,bash,pwsh,task,checkout,downloadorpublish. Steps run sequentially on the same agent and share the file system and environment, but each is its own process, so exporting a shell variable requires the##vso[task.setvariable]logging command.
This diagram shows how the levels nest and where parallelism occurs.
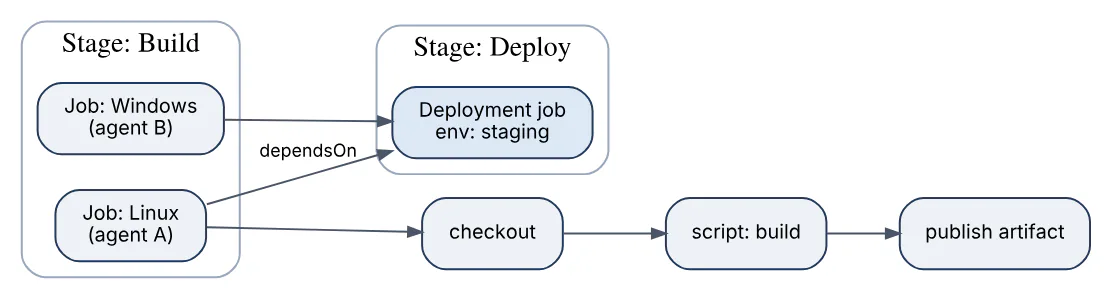
Passing data up the hierarchy uses output variables (isOutput=true) referenced as dependencies.Build.outputs['Compile.setVersion.version'] at stage level, and artifacts for files.
14In a real project using Azure DevOps, how would you apply, test, or troubleshoot stages jobs steps?
Apply. In a reporting-platform pipeline I split work into Build (one job per component, run in parallel), Verify (integration tests against a containerised database using services:), and Deploy_Dev, Deploy_Test, Deploy_Prod deployment jobs targeting environments. The build job writes the computed version with echo "##vso[task.setvariable variable=version;isOutput=true]$VER" and deploy stages consume it through stageDependencies. Production uses condition: and(succeeded(), eq(variables['Build.SourceBranch'], 'refs/heads/main')).
Test. I run the pipeline with “Stages to run” limited to Build and Verify on a feature branch, then check the stage dependency graph in the run summary to confirm fan-out and fan-in match the design. For output variables I add an assertion step that fails the job if the variable is empty, which catches naming typos immediately rather than at deploy time.
Troubleshoot. An empty cross-stage variable is almost always a wrong reference path: the job name, the step name: (not displayName) and isOutput=true must all match. A stage that is skipped despite a passing predecessor is usually a condition referencing a variable only available in the earlier job. Jobs queued indefinitely indicate no agent in the pool satisfies demands or parallel-job capacity is exhausted, visible under Project settings, Parallel jobs. A step that “ran but did nothing” often ran on a different job and therefore a different workspace than the step that produced its input.
Key trade-off: more jobs means more parallelism but every job pays checkout and setup cost again.
15Explain pipeline triggers and PR builds in the context of Azure DevOps.
Triggers decide when a YAML pipeline runs without someone pressing Run.
- CI trigger (
trigger:) fires on pushes to matching branches, with optionalpathsandtagsfilters andbatch: trueto coalesce rapid pushes into one run. - PR trigger (
pr:) builds pull requests. For Azure Repos thepr:key is ignored; PR builds come from the build validation branch policy instead. For GitHub and Bitbucket repospr:in YAML is what controls it. - Scheduled trigger (
schedules:with cron in UTC) runs nightly or weekly, optionally only if the branch changed (always: false). - Pipeline resource trigger starts a pipeline when another pipeline completes, used to chain build and release pipelines.
- Repository resource trigger fires on changes in another repository.
trigger:
  batch: true
  branches:
    include: [main, release/*]
  paths:
    exclude: [docs/**, '*.md']
pr: none          # Azure Repos: PR validation via branch policy
schedules:
- cron: '0 2 * * 1-5'
  displayName: Nightly
  branches:
    include: [main]
  always: false
A PR build checks out the merge commit (refs/pull/<id>/merge) and exposes System.PullRequest.* variables; Build.Reason is PullRequest, which lets steps skip deployments. Omitting trigger entirely means “build every branch”, a common surprise.
16In a real project using Azure DevOps, how would you apply, test, or troubleshoot pipeline triggers and PR builds?
Apply. For a monorepo holding six services I give each service its own pipeline with paths: include: [services/orders/**, shared/**] so a change to the catalog does not rebuild orders. main and release/* have CI triggers with batch: true; all other branches build only through the PR build validation policy, where the pipeline short-circuits deploy stages on eq(variables['Build.Reason'], 'PullRequest'). A nightly schedule runs the long integration suite.
Test. I verify path filters by pushing a docs-only commit and confirming no run, then a commit touching shared/ and confirming all six run. For PR validation I open a PR and check the policy queues the correct pipeline and that System.PullRequest.TargetBranch is populated. The “Triggers” tab in the run shows which filter matched.
Troubleshoot. A pipeline that never triggers often has the YAML on a branch where the trigger block differs; triggers are read from the branch being pushed, except for the default branch override setting. Schedules that do not fire are usually always: false on an unchanged branch, or the cron written in local time. PR builds starting but not reporting back indicate the policy points at a different pipeline definition than the one edited. Duplicate runs appear when both pr: on GitHub and a status check are configured. Build.Reason and Build.SourceBranch printed in the first step settle most arguments.
Consideration: path filters do not apply to tags and wildcards must be quoted when they start with *.
17Explain variable groups and secrets in the context of Azure DevOps.
A variable group is a named set of key-value pairs stored in the Library at project level and shared by any pipeline that references it with variables: - group: name. Values can be plain or marked secret; secret values are encrypted at rest, masked in logs, and are not exposed as environment variables automatically; a step must map them explicitly with env: MY_KEY: $(mySecret).
A variable group can also be linked to an Azure Key Vault, in which case the group lists secret names and the pipeline pulls values at run time through a service connection, so rotation happens in the vault without touching Azure DevOps.
variables:
- group: orders-prod        # from Library
- name: region
  value: westeurope
steps:
- script: ./deploy.sh
  env:
    DB_PASSWORD: $(dbPassword)   # secret mapped explicitly
Secrets elsewhere: pipeline-level secret variables set in the UI, secure files for certificates and keystores, and the AzureKeyVault@2 task that downloads vault secrets directly into variables. Variable groups carry their own permissions and can require pipeline authorization, so a new pipeline cannot read production secrets until an administrator approves it. Secret variables cannot be used in condition at compile time and are not passed to forked-repository PR builds.
18In a real project using Azure DevOps, how would you apply, test, or troubleshoot variable groups and secrets?
Apply. For a payments service I keep non-sensitive settings (region, appServiceName) in groups payments-common and payments-<env>, and all secrets in Key Vault-linked groups so no secret value is ever typed into Azure DevOps. Each production group is authorized only for the production release pipeline, and editing rights sit with a two-person platform team. Secrets reach the application through Key Vault references in App Service settings, not pipeline variables, so the pipeline only needs them for migrations.
Test. A dry run prints echo "DB host: $(dbHost)" for non-secrets and echo ${#DB_PASSWORD} (the length only) to prove the secret was injected without revealing it. I also confirm masking: deliberately echoing the secret should print ***. For Key Vault-linked groups I rotate a test secret and run again to confirm the new value arrives.
Troubleshoot. An empty secret in a Bash step is the classic symptom and nearly always means the env: mapping was omitted. “Variable group not found or not authorized” appears when a new pipeline references a protected group before approval; the run’s Permissions needed banner resolves it. Key Vault-linked groups fail with 403 Forbidden when the service connection identity lacks the Get/List secret permission or RBAC role. Masking also mangles output that happens to contain the secret’s value, such as a short token “dev”, which looks like a corrupted log.
Important consideration: secrets with special characters can break $(var) substitution in scripts; pass them via env: rather than inline.
19Explain service connections in the context of Azure DevOps.
A service connection is a project-scoped, stored credential plus endpoint definition that pipelines use to talk to external systems: Azure Resource Manager, Docker registries, Kubernetes clusters, GitHub, SonarQube, generic HTTPS services, and many more via extensions. Tasks reference it by name (azureSubscription: 'sc-prod') and never see the raw secret.
For Azure Resource Manager the authentication options are:
| Scheme | How it authenticates | Notes |
|---|---|---|
| Workload identity federation | Entra app or managed identity trusts Azure DevOps OIDC tokens | No secret stored, nothing expires; recommended |
| Service principal (secret) | Client ID and secret | Secret rotation required |
| Service principal (certificate) | Client certificate | Rotation required |
| Managed identity | Self-hosted agent’s identity | Only on Azure-hosted agents you own |
Workload identity federation works by Azure DevOps presenting a short-lived token with an issuer and subject (sc://org/project/connection-name) that the Entra app has a federated credential for; Entra exchanges it for an access token at run time.
The diagram shows how a pipeline task reaches Azure through a federated service connection without any stored secret.

Governance features: pipeline authorization (approve each pipeline or “grant to all”), approvals and checks on the connection itself, per-connection security roles, and sharing a connection across projects. Service connections are the main privilege boundary between code and cloud, so least privilege means one connection per environment and subscription scope rather than a tenant-wide owner.
20In a real project using Azure DevOps, how would you apply, test, or troubleshoot service connections?
Apply. For a three-environment Azure estate I create sc-dev, sc-test and sc-prod, each using workload identity federation to a user-assigned managed identity that has Contributor on exactly one resource group set. sc-prod is authorized only to the release pipeline and carries a check requiring the production environment approval, so even a modified YAML cannot use it without a human. The container registry gets its own Docker Registry connection backed by the same identity.
Test. The Verify button in the connection settings proves authentication, but I also run a pipeline that executes az account show and az group list through AzureCLI@2 to confirm the scope is right and no more. A negative test tries to deploy to the production resource group with sc-dev and must fail with an authorization error.
Troubleshoot. AADSTS700213 or “no matching federated identity record” means the federated credential’s issuer or subject does not match; the connection’s details page shows the exact subject string to paste. AuthorizationFailed from ARM is RBAC scope, not authentication. A pipeline reporting “service connection not authorized for use” needs the pipeline-level authorization. After renaming a connection the federated subject changes and must be updated. For legacy secret-based connections, expired secrets surface as AADSTS7000222; converting the connection to federation removes the problem permanently.
The consideration is blast radius: a connection scoped at subscription level with Owner rights turns any pipeline edit into a tenant-wide risk.
21Explain pipeline templates in the context of Azure DevOps.
Templates let YAML be reused and governed. A template is a YAML file, in the same repository or in another one referenced under resources: repositories, that a pipeline includes with template: or inherits from with extends:.
- Step, job, stage and variable templates are included where that construct would appear and accept typed
parameters(string, number, boolean, object, step, stepList, jobList, stageList). - Extends templates define the whole pipeline skeleton; the consuming pipeline only passes parameters. Combined with a required template check on an environment or service connection, this guarantees that protected resources are only used by pipelines built from the approved template.
- Template expressions
${{ if }},${{ each }}and${{ parameters.x }}are evaluated when the pipeline is compiled, so templates can generate jobs from a list.
parameters:   # file: templates/build-dotnet.yml
- name: project
  type: string
- name: configuration
  type: string
  default: Release
steps:
- task: UseDotNet@2
  inputs: { version: '8.x' }
- script: dotnet test ${{ parameters.project }} -c ${{ parameters.configuration }}
  displayName: Test ${{ parameters.project }}
Consumption: - template: templates/build-dotnet.yml@templates with parameters: project: src/Orders.sln. Versioning is handled by pinning the repository resource to a branch or tag (ref: refs/tags/v2.1.0), so template authors can ship changes without breaking consumers.
22In a real project using Azure DevOps, how would you apply, test, or troubleshoot pipeline templates?
Apply. For thirty microservices I maintain a pipeline-templates repository with an extends template service-pipeline.yml that wires build, test, container scan, publish and deployment jobs, and leaf step templates for .NET, Node and container builds. Services pass serviceName, dockerfilePath and an environments object list; ${{ each env in parameters.environments }} generates one deployment stage per entry. Production environments carry a required-template check so only pipelines extending from service-pipeline.yml@templates can deploy.
Test. The templates repo has its own pipeline that compiles sample consumers against the proposed change using the “Preview” REST endpoint (POST .../pipelines/{id}/preview) to get the expanded YAML without running, then runs one real end-to-end sample against a sandbox environment. Consumers pin ref: refs/tags/v3; breaking changes bump the major tag and are announced.
Troubleshoot. “Template file not found” is nearly always a missing @alias or a ref that does not contain the file. Parameter type errors (“expected string, got object”) come from a consumer passing a list to a scalar. A step that behaves differently from a plain pipeline is usually a ${{ }} expression evaluated at compile time against a value that only exists at run time. When a required-template check rejects a run, the message names the template actually used, which exposes consumers that copied instead of extended.
Consideration: templates are compiled into the consumer at queue time, so a hotfix to the template does not change runs already queued.
23Explain environments and approvals in the context of Azure DevOps.
An environment in Azure Pipelines is a named deployment target (dev, staging, production) with a history of every deployment job that targeted it, optional resources (Kubernetes namespaces, virtual machines, which enable deployment-group-style targeting), and approvals and checks that run before any stage may use it.
Deployment jobs bind to an environment:
- stage: Deploy_Prod
  jobs:
  - deployment: DeployWeb
    environment: production
    strategy:
      runOnce:
        deploy:
          steps:
          - download: current
            artifact: drop
          - task: AzureWebApp@1
            inputs:
              azureSubscription: sc-prod
              appName: orders-web
              package: $(Pipeline.Workspace)/drop/*.zip
Checks available on an environment (and equally on service connections, variable groups, agent pools and secure files):
- Approvals by named users or groups, with timeout and “requester cannot approve” option.
- Branch control, allowing only
refs/heads/mainor protected branches. - Business hours, Required template, Evaluate artifact (policy on container images), Invoke Azure Function / REST API, Query Azure Monitor alerts, and Exclusive lock to serialise deployments.
The diagram shows a stage waiting on an environment’s checks before its deployment job is allowed to run.

Checks run before the stage starts and are re-evaluated per stage, so a pipeline with three stages targeting production would ask three times unless the approval is configured once per run. Environment permissions control who can create pipelines against it and who administers checks, which is the separation between developers and release owners.
24In a real project using Azure DevOps, how would you apply, test, or troubleshoot environments and approvals?
Apply. For an online-banking web front end I define dev (no checks), uat (branch control on release/* and main), and production with an approval from the change-management group, a business-hours window, an exclusive lock so two releases never overlap, and an Azure Monitor check that fails the stage if a Sev-1 alert is active. Production also has the required-template check. The environment’s deployment history gives auditors the “who approved what, when” record without a separate tool.
Test. I rehearse the full flow on uat with the same checks configured but lenient values, confirming the approval email arrives, the approver can see the diff of commits since the last deployment, and a rejected approval marks the stage failed rather than skipped. I also test the timeout by letting a run sit until the configured limit expires. Branch control is tested by running from a feature branch, which must be blocked with a clear message.
Troubleshoot. A stage stuck in “waiting” shows the pending check in the stage panel; most often it is an approver who is a disabled account or a group with no members. Exclusive-lock stalls usually mean an earlier run is itself waiting on approval and still holds the lock. “Environment not found” on first use is permissions: by default new environments are created automatically, which teams later disable. The Azure Monitor check requires the service connection to have Reader on the alert resource group.
Important consideration: approvals time out at a maximum of 30 days, so forgotten runs eventually fail rather than wait forever.
25Explain artifact feeds and packages in the context of Azure DevOps.
A feed is a package repository hosted by Azure Artifacts. One feed can serve several protocols at once: NuGet, npm, Maven, Python (PyPI), Cargo and Universal Packages. Feeds are either project-scoped (recommended, inherit project permissions) or organization-scoped (older, visible to every project).
Key mechanics:
- Upstream sources let a feed proxy public registries (nuget.org, npmjs.com, Maven Central, PyPI) and other Azure Artifacts feeds. The first request fetches and caches the package; thereafter the build depends only on the feed, which protects against upstream outages and left-pad style deletions.
- Views (
@local,@prerelease,@release) are filtered windows over a feed; promoting a package version to@releaseis how a team signals it is supported without re-publishing. - Retention policies delete old versions not downloaded recently, but promoted versions are kept.
- Permissions are Reader, Collaborator (can save upstream packages), Contributor (can publish) and Owner.
- Authentication uses Entra ID for interactive users, personal access tokens, or
System.AccessTokenfor pipelines via the authenticate tasks (NuGetAuthenticate@1,npmAuthenticate@0,PipAuthenticate@1).
The diagram shows upstream caching on the restore side and view promotion on the publish side of one feed.
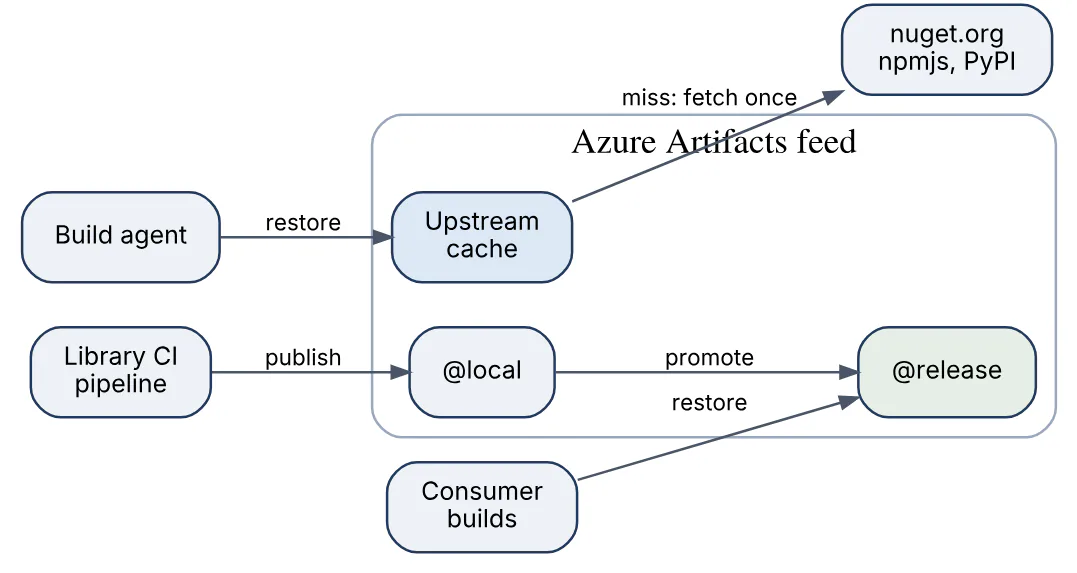
In a pipeline the typical pair is dotnet pack then NuGetCommand@2 push with publishVstsFeed: 'Commerce/shared-libs'. A package version is immutable once published; republishing the same version is rejected, which is what makes consumer builds reproducible.
26In a real project using Azure DevOps, how would you apply, test, or troubleshoot artifact feeds and packages?
Apply. For an insurance platform I create one project feed platform-packages with upstreams to nuget.org and npmjs, and route every build through it by committing a nuget.config and .npmrc pointing only at the feed. Shared libraries (Platform.Messaging, @platform/ui-kit) are published by their CI pipelines using System.AccessToken, with the project build service granted Contributor. Release candidates publish to @local; after integration tests pass a pipeline step promotes the version to @release, and consuming teams’ nuget.config points at platform-packages@release.
Test. A clean agent build with network egress blocked except to pkgs.dev.azure.com proves every dependency resolves through the feed. I also test the promotion flow by publishing version 1.4.0-rc. 1 and confirming a consumer pinned to @release does not see it until promoted.
Troubleshoot. 401 Unauthorized on restore means the authenticate task ran before the nuget.config was present or the build service lacks Reader; 403 on publish is a missing Contributor role. “Package not found” through an upstream frequently means the package was never saved because the requesting identity only had Reader (saving from upstream needs Collaborator). Publishing 409 Conflict is the immutability rule firing on a reused version number, fixed by proper versioning rather than deleting. dotnet nuget locals all --clear rules out local cache confusion.
The consideration is storage: feeds count toward the organization’s Artifacts quota, so retention policies and views need to be set from the start.
27Explain Azure Artifacts in the context of Azure DevOps.
Azure Artifacts is the package-management service inside Azure DevOps. It provides feeds for NuGet, npm, Maven, Python, Cargo and Universal Packages (an Azure DevOps-specific format for arbitrary file sets up to large sizes, pushed and pulled with az artifacts universal). (The previous question covered feed mechanics; this one is about the service’s role.)
Its place in the delivery chain:
- Dependency control: a single curated source for all third-party packages, with upstream caching and the ability to block or allow specific external packages.
- Internal sharing: libraries, SDKs, Helm charts (through OCI registries elsewhere, or as Universal Packages) and build outputs shared between teams and projects.
- Release promotion: views move a version from candidate to released without rebuilding.
- Supply-chain security: packages are immutable, provenance shows which pipeline published a version, and Microsoft Defender-style scanning can be layered via extensions.
Billing is by storage: every organization receives a free allowance (2 GiB) and pays per GiB beyond it, which is why retention policies exist. Azure Artifacts is distinct from pipeline artifacts (publish: / download: steps), which are build-scoped files stored with the run and governed by run retention rather than feeds. Choosing between the two is simple: if another pipeline or team should consume it by version, it belongs in a feed; if only later stages of the same run need it, it is a pipeline artifact.
28In a real project using Azure DevOps, how would you apply, test, or troubleshoot Azure Artifacts?
Apply. In a data-platform programme I use Azure Artifacts for three things: a Python feed for shared ingestion libraries published with twine after PipAuthenticate@1; Universal Packages for versioned machine-learning model bundles (az artifacts universal publish --name churn-model --version 2.3.0), which deployment pipelines download by exact version; and a Maven feed as the single source for Spark job dependencies, with upstream to Maven Central. Project-scoped feeds keep permissions aligned with project membership.
Test. CI for a library runs pip install of the just-published version from a clean virtual environment on a second agent, proving the metadata and wheels are correct. For model bundles a checksum file is published alongside and verified after download. I periodically audit the feed with the REST API to list versions never downloaded in 90 days and confirm retention would remove them.
Troubleshoot. twine upload failing with 401 usually means the index URL lacks the /upload suffix or the token is for a different organization. Universal Package downloads that are slow point at very large single files; splitting bundles helps because the client parallelises chunks. “Package has been unlisted or deleted” after retention indicates a consumer pinned a version that was never promoted; promoting protects it. When Maven resolution picks the wrong artifact, the local ~/.m2 cache on a self-hosted agent is the usual culprit and a Cache@2 key change or a clean purge resolves it.
Key consideration: deleted package versions enter a recycle bin for 30 days, but a reused version number is still rejected, so version numbers are permanently consumed.
29Explain build caching in the context of Azure DevOps.
Build caching in Azure Pipelines is pipeline caching with the Cache@2 task: a directory on the agent is saved at the end of a successful job under a key, and restored at the start of later jobs whose key matches. It is designed for dependency and compiler caches (NuGet packages, npm or Yarn store, Maven .m2, pip wheels, Gradle caches, Docker layers via a tarball) rather than build outputs.
variables:
  NUGET_PACKAGES: $(Pipeline.Workspace)/.nuget/packages
steps:
- task: Cache@2
  inputs:
    key: 'nuget | "$(Agent.OS)" | **/packages.lock.json,!**/bin/**'
    restoreKeys: |
      nuget | "$(Agent.OS)"
    path: $(NUGET_PACKAGES)
  displayName: Restore NuGet cache
- script: dotnet restore --locked-mode
How it behaves:
- The key is a list of segments; file globs are hashed, so the key changes when lock files change.
restoreKeysgive prefix fallbacks for a partial hit. - Caches are scoped to the pipeline and to the branch, with the default branch as a fallback source, and are immutable once written for a given key.
- A cache entry expires after seven days without use; there is no manual delete, only a key change.
- The cache is uploaded only on job success and only if the key did not already exist.
Caching is separate from the incremental checkout and workspace on self-hosted agents, where workspace: clean: controls what persists between runs, and from Microsoft-hosted agents, which start from a fresh image every job and therefore gain the most from Cache@2.
30In a real project using Azure DevOps, how would you apply, test, or troubleshoot build caching?
Apply. On a Node and .NET monorepo running on Microsoft-hosted agents I cache the npm store keyed on package-lock.json, the NuGet global packages folder keyed on packages.lock.json, and the SonarQube scanner cache keyed on the scanner version. Restore steps use npm ci --prefer-offline and dotnet restore --locked-mode so a cache hit means no network. Docker builds use a registry cache (--cache-from) instead of Cache@2 because layer tarballs are too large to pay off.
Test. The measure is time and hit rate: the Cache@2 restore step logs “Cache hit” or “Cache miss” plus the resolved key, and I compare restore duration before and after. A good test is three consecutive runs: run one misses and saves, run two hits exactly, run three after a dependency bump misses on the exact key but hits on the restore key. I keep a dashboard widget of job duration to verify the gain persists.
Troubleshoot. Constant misses are nearly always a key that contains something volatile ($ (Build.BuildId), a timestamp, or a glob matching generated files in bin/). A cache that restores but builds still download is a path mismatch: the cached folder is not the one the tool reads, typically because NUGET_PACKAGES was not set for the restore step. “Cache not saved” on a green job means the key already existed or the job post-step was skipped by a condition. Hits from the default branch but not the feature branch are expected fallback behaviour, not a bug.
Important consideration: a cache larger than a few hundred megabytes can take longer to download than the dependencies it replaces, so cache the store, not node_modules.
31Explain self hosted agents in the context of Azure DevOps.
A self-hosted agent is the Azure Pipelines agent software installed on infrastructure you control: a VM, a container, a Kubernetes pod or a physical machine, registered to an agent pool in the organization. The agent long-polls Azure DevOps for jobs, so no inbound firewall rules are needed, and runs steps under the account it was installed with.
Reasons to use them:
- Access to private networks (on-premises databases, VNets, internal registries) that Microsoft-hosted agents cannot reach.
- Pre-installed heavyweight toolchains, large caches and persistent workspaces, which makes incremental builds much faster.
- Custom hardware (GPU, macOS fleets, ARM), longer timeouts, and no per-minute hosted charge; billing is per concurrent parallel job.
- Compliance scenarios requiring that source code never leave a controlled environment.
The diagram shows a self-hosted agent inside a private network polling an agent pool and reaching internal systems.
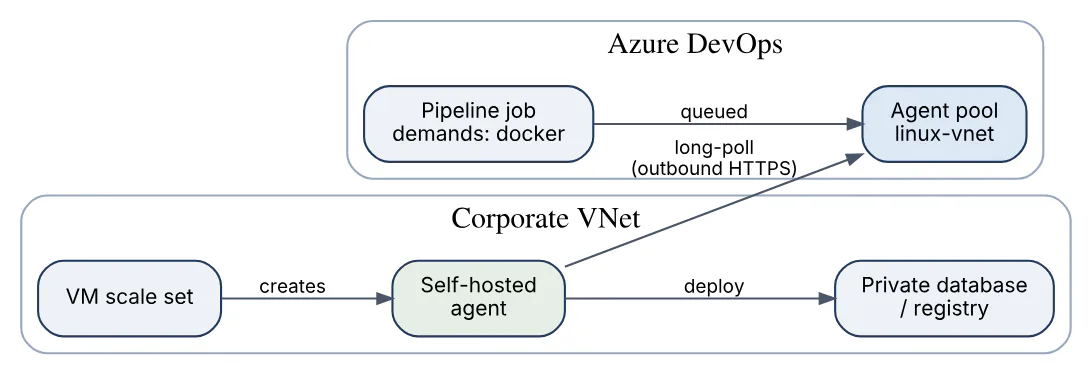
Operational aspects: agents advertise capabilities (installed software, custom key-values) that jobs select with demands; pools can be shared to projects and protected with approvals and checks; agent versions auto-update from the service. Scale set agents (Azure VM Scale Set pools) let Azure DevOps create and tear down agents on demand with a configurable warm pool, and container-based agents running in AKS are a common alternative using KEDA to scale on queue length. Agents can also run as deployment group targets for classic release pipelines or as environment VM resources.
32In a real project using Azure DevOps, how would you apply, test, or troubleshoot self hosted agents?
Apply. For a system that deploys to databases inside a corporate VNet I run a scale set agent pool linux-vnet on Azure VM Scale Sets with a golden image baked by Packer containing Docker, .NET, Node, Terraform and the az CLI, and a Windows pool for legacy MSBuild projects. Idle count is two, maximum twenty, and agents are recycled after each job so secrets never persist between runs. The pool is protected by a check so only approved pipelines use it, and the VM identity is used for Key Vault access.
Test. A smoke pipeline with demands: [docker, terraform] runs hourly and asserts tool versions, outbound connectivity to the package feed and the database subnet, and disk free space, posting failures to the platform channel. Image updates go through this pipeline on a canary pool before the main pool is switched.
Troubleshoot. A job stuck “waiting for an agent” with agents online means a demands mismatch; the pool’s Capabilities tab shows what each agent advertises. Agents going offline after reboots indicate the service was not installed with --runAsService. Disk-full failures come from workspaces never being cleaned; workspace: clean: all or recycling solves it. Jobs failing only on self-hosted agents are usually tool-version drift versus the hosted image, confirmed by printing versions as the first step. Agent logs in _diag/ show connectivity errors such as proxy or TLS inspection problems when agents cannot reach dev.azure.com.
Consideration: a long-lived agent with a cached workspace is fast but is also a shared machine; one pipeline can poison the next unless each job runs in a fresh VM or container.
33Explain Microsoft hosted agents in the context of Azure DevOps.
Microsoft-hosted agents are virtual machines that Microsoft provisions, patches and discards for every job. A pipeline selects one with pool: vmImage: <label>; labels include ubuntu-latest, ubuntu-24.04, ubuntu-22.04, windows-latest, windows-2025, windows-2022, macos-latest and specific macOS versions. The -latest aliases move forward over time, so pinning an explicit version is the way to avoid surprise toolchain changes; Microsoft publishes retirement schedules with brownout periods before removing an image.
Properties that matter in practice:
- Each job starts from a clean image with a broad preinstalled toolset (SDKs, browsers, Docker on Linux, Visual Studio on Windows); nothing persists between jobs, so caching matters.
- Jobs have time limits (60 minutes on the free tier, 360 minutes for paid parallel jobs) and fixed VM sizes (2 vCPU, 7 GB RAM on standard images; larger sizes exist as a paid option in some regions).
- Agents run with public IP ranges that change weekly; access to private resources requires the Azure service tag or a self-hosted agent.
- Capacity is defined by parallel jobs: new organizations must request the free Microsoft-hosted grant, and additional parallel jobs are bought per month.
- No administrator access to the image build, but
sudoand admin rights exist inside the job.
They are the right default for open-source style builds and anything without network constraints; self-hosted agents take over when private connectivity, special hardware, or very long or very frequent jobs make the economics or the reach of hosted agents unsuitable.
34In a real project using Azure DevOps, how would you apply, test, or troubleshoot Microsoft hosted agents?
Apply. For a SaaS product whose services deploy to public Azure endpoints I run all CI on ubuntu-22.04 pinned explicitly, with a scheduled job that also runs the suite on ubuntu-latest to detect upcoming image changes early. Windows-only installers build on windows-2022. Because every job is a fresh VM I rely on Cache@2, keep jobs under 15 minutes, and use UseDotNet@2 / NodeTool@0 to pin toolchain versions rather than trusting what the image ships.
Test. Readiness is verified by a daily canary pipeline that prints $(Agent.OS), ImageVersion from the agent environment, and tool versions, failing when a version differs from a recorded baseline; the image’s software list on GitHub (actions/runner-images) is checked against the readme published in each run. Load behaviour is tested by queuing ten concurrent runs and confirming parallel-job capacity is sufficient.
Troubleshoot. A job that “worked yesterday” and fails today is usually an image roll; the ImageVersion value in the job’s Initialize step confirms it, and pinning or installing the tool explicitly fixes it. Connection timeouts to a SQL database behind a firewall mean the hosted IPs are blocked; either allow the AzureCloud service tag for the region or move to a self-hosted agent. “No hosted parallelism has been purchased or granted” requires the parallelism request form. Jobs cancelled at exactly 60 minutes hit the free-tier limit.
The key consideration is that hosted agents trade control for zero maintenance; anything requiring custom kernel modules, persistent state or private network reach is out of scope.
35Explain parallel jobs and matrix builds in the context of Azure DevOps.
A parallel job is a licensing and scheduling unit: the number of jobs an organization can run at the same time, separately counted for Microsoft-hosted and self-hosted agents. Microsoft-hosted capacity is a free grant plus purchased slots; self-hosted includes one free job plus one per Visual Studio Enterprise subscriber, with more purchasable. Jobs beyond capacity queue.
Within a pipeline, jobs run in parallel when they have no dependsOn relationship. A matrix strategy expands one job definition into several copies with different variable sets, and slicing splits one test suite across N identical agents.
jobs:
- job: Test
  strategy:
    matrix:
      linux_net8:
        imageName: ubuntu-latest
        dotnetVersion: '8.x'
      windows_net8:
        imageName: windows-latest
        dotnetVersion: '8.x'
    maxParallel: 2
  pool:
    vmImage: $(imageName)
  steps:
  - task: UseDotNet@2
    inputs: { version: $(dotnetVersion) }
  - script: dotnet test
Each matrix entry becomes a job named Test linux_net8, and so on. parallel: 4 instead of matrix creates N identical jobs with System.JobPositionInPhase and System.TotalJobsInPhase variables, which the VSTest@2 task uses to distribute tests automatically and which custom scripts can use to shard. maxParallel caps how many expanded jobs run at once so one pipeline does not starve others of parallel-job capacity.
36In a real project using Azure DevOps, how would you apply, test, or troubleshoot parallel jobs and matrix builds?
Apply. For a cross-platform SDK I use a matrix over three operating systems and two runtime versions in CI, generated from an ${{ each }} loop over a parameter list so adding a target is a one-line change. The 40-minute end-to-end test suite is split with parallel: 4 and a sharding script that uses System.JobPositionInPhase to select a quarter of the test assemblies, bringing wall time to about 12 minutes. The organization has eight hosted parallel jobs, so maxParallel: 4 on the matrix leaves capacity for other teams.
Test. I validate the sharding by publishing test results from each shard with a distinct testRunTitle and confirming the merged count equals the serial run’s count, catching tests silently dropped by a bad modulo. The run’s job graph verifies the matrix expanded as expected and that no job waited on another unintentionally.
Troubleshoot. Jobs queued with “waiting for available parallel job” indicate capacity exhaustion; the Parallel jobs page shows in-progress usage across the organization, and large matrices from other teams are the usual culprit. A matrix job failing only on one entry is often an $(imageName) variable reference that is case-sensitive or a tool missing on that image. Flaky distributed tests often come from shards sharing a database; each shard gets its own schema or container. A parallel: job that runs every test on every agent means the sharding filter was never applied, visible by comparing durations.
Consideration: matrix expansion multiplies cost quickly, so platforms that rarely differ are better covered by a nightly matrix than on every PR.
37Explain deployment strategies canary blue green in the context of Azure DevOps.
Deployment strategies control how a new version replaces the old one to limit risk. Azure Pipelines deployment jobs have built-in runOnce, rolling and canary strategies with lifecycle hooks (preDeploy, deploy, routeTraffic, postRouteTraffic, on: failure/success), while blue-green is implemented with platform features.
| Strategy | Mechanism | Rollback | Typical target |
|---|---|---|---|
| Blue-green | Two full environments; switch traffic from blue to green | Switch back instantly | App Service slots, two AKS deployments, load-balancer pools |
| Canary | Route a small percentage to the new version, observe, increase | Shift traffic back to stable | AKS with service mesh or Ingress, Front Door weights |
| Rolling | Replace instances in batches | Redeploy previous version | VM sets, Kubernetes rolling update |
The diagram shows a canary rollout controlled from a pipeline.

In YAML, strategy: canary: increments: [10, 50] runs the deploy hook once per increment and the routeTraffic hook lets you adjust weights; the KubernetesManifest@1 task understands this natively for AKS. For App Service, blue-green is AzureAppServiceManage@0 with SwapSlots, deploying to staging then swapping to production.
38In a real project using Azure DevOps, how would you apply, test, or troubleshoot deployment strategies canary blue green?
Apply. For a checkout API on App Service I deploy to the staging slot, run smoke tests against the slot URL, then swap with AzureAppServiceManage@0 for blue-green; connection strings are marked slot-sticky so the swap moves code, not configuration. For the AKS-hosted catalog service I use a deployment job with strategy: canary: increments: [10, 50], KubernetesManifest@1 to create the canary pods, an Istio VirtualService weight update in routeTraffic, and an Azure Monitor check between increments that aborts if error rate exceeds one percent.
Test. Before production the same stages run against the UAT cluster with synthetic traffic from a load generator so canary analysis has real metrics. A deliberately broken image (returns 500 on /health)
is deployed to confirm the on: failure hook scales the canary to zero and traffic returns to stable, and a swap-back rehearsal on App Service proves the blue slot still works after swap.
Troubleshoot. Slot swaps that “succeed” but serve old code usually mean swap-with-preview warm-up failed, or an app setting was not slot-sticky so the swapped app connected to the wrong database. Canary pods receiving no traffic point at label selectors differing between stable and canary manifests. Error-rate checks that never fail are frequently alerts scoped to the stable deployment only. For long-lived connections, the canary percentage never matches configured weights because existing sessions stay on stable; measuring new sessions only avoids false conclusions.
The main consideration is database compatibility: both versions run concurrently, so schema changes must be backward compatible for blue-green or canary to be safe.
39Explain CI/CD for .NET apps in the context of Azure DevOps.
CI/CD for .NET on Azure Pipelines is a YAML pipeline using the .NET SDK tasks or plain dotnet CLI commands, producing a deployable artifact and pushing it to Azure or on-premises hosts.
The canonical stages:
- Build:
UseDotNet@2to pin the SDK,dotnet restoreagainst the Artifacts feed,dotnet build -c Release, and version stamping with-p:Version=$(semver). - Test:
dotnet test --collect:"XPlat Code Coverage"with thePublishTestResults@2andPublishCodeCoverageResults@2tasks (or the built-in publishing ofDotNetCoreCLI@2), so results appear in the run’s Tests and Coverage tabs. - Package:
dotnet publish -o $(Build.ArtifactStagingDirectory)andpublish: ... artifact: drop, or a Docker image built from a multi-stage Dockerfile and pushed withDocker@2. - Deploy:
AzureWebApp@1for App Service,AzureFunctionApp@2for Functions,KubernetesManifest@1for AKS, orIISWebAppDeploymentOnMachineGroup@0for on-prem IIS, inside deployment jobs with environment approvals.
steps:
- task: UseDotNet@2
  inputs: { packageType: sdk, version: '8.x' }
- task: DotNetCoreCLI@2
  displayName: Test
  inputs:
    command: test
    projects: '**/*Tests.csproj'
    arguments: '-c Release --collect:"XPlat Code Coverage"'
- task: DotNetCoreCLI@2
  displayName: Publish
  inputs:
    command: publish
    publishWebProjects: true
    arguments: '-c Release -o $(Build.ArtifactStagingDirectory)'
    zipAfterPublish: true
.NET Framework projects still need Windows agents and VSBuild@1 / NuGetCommand@2; modern .NET builds anywhere, including Linux containers.
40In a real project using Azure DevOps, how would you apply, test, or troubleshoot CI/CD for .NET apps?
Apply. For an ASP.NET Core order service I use a shared template: restore from the project feed with lock files, build once, test with coverage, then dotnet publish and build a container from the published output using a mcr.microsoft.com/dotnet/aspnet:8.0 runtime image. EF Core migrations are generated as an idempotent SQL script (dotnet ef migrations script --idempotent) and applied by a dedicated step before the app deploys, under the production approval. Deployment goes to App Service staging slot then swap.
Test. CI gates: unit tests must pass, coverage must not fall below the previous run (checked by a build-quality policy on the PR), and a dotnet format --verify-no-changes step enforces style. Integration tests run with services: containers for SQL Server and Redis. Post-deploy, a smoke test hits /health/ready on the slot before swap.
Troubleshoot. Builds that pass locally but fail with NETSDK1045 need the SDK pinned with UseDotNet@2. Restore failures against the feed are authentication order problems, fixed by NuGetAuthenticate@1 before restore. Tests passing but no Tests tab means --logger trx output was not published; the DotNetCoreCLI@2 test command handles this automatically but plain script steps do not. Deployed app returning HTTP 500.30 means a runtime mismatch between publish target and the App Service stack setting. Slow CI is usually restore without caching or missing --no-build on test and publish.
Important consideration: run dotnet build once and pass --no-build downstream; rebuilding in test and publish steps doubles time and can produce inconsistent binaries.
41Explain CI/CD for Azure Functions in the context of Azure DevOps.
Azure Functions deploy as a package (zip) or container, so the pipeline builds the function project, publishes it, and uses the AzureFunctionApp@2 task (or AzureFunctionAppContainer@1 for container-hosted functions) to deploy. Hosting plan and language shape the details:
- Consumption and Flex Consumption: zip deploy; Flex Consumption and Linux Consumption use run-from-package semantics so the package is mounted rather than extracted, which makes deployments atomic.
- Premium and Dedicated plans support deployment slots, enabling the staging-then-swap pattern.
- Containerised functions (Premium or Azure Container Apps hosting) use a Docker image built from the Functions base image and deployed by image tag.
- task: AzureFunctionApp@2
  inputs:
    connectedServiceNameARM: sc-prod
    appType: functionAppLinux
    appName: orders-fn-prod
    package: $(Pipeline.Workspace)/drop/*.zip
    runtimeStack: DOTNET-ISOLATED|8.0
    deploymentMethod: runFromPackage
    appSettings: >-
      -FUNCTIONS_WORKER_RUNTIME dotnet-isolated
      -ServiceBusConnection__fullyQualifiedNamespace $(sbNamespace)
Language-specific build steps precede this: dotnet publish for .NET isolated, npm ci && npm run build with production dependencies for Node, pip install --target .python_packages/lib/site-packages for Python, or mvn package azure-functions:package for Java. Configuration goes in app settings, ideally as Key Vault references, so the pipeline never writes secrets. Infrastructure (plan, storage account, Application Insights) is created by Bicep in an earlier stage so the deploy step targets a known app.
42In a real project using Azure DevOps, how would you apply, test, or troubleshoot CI/CD for Azure Functions?
Apply. For an event-driven invoicing system with .NET isolated functions on a Premium plan I build and publish the project to a zip, deploy to a staging slot with AzureFunctionApp@2 using deployToSlotOrASE: true, run contract tests against the slot, and swap. Infrastructure is Bicep in a preceding stage, using identity-based connections (__fullyQualifiedNamespace settings) so no connection strings exist. Each function app has its own pipeline stage but shares the template.
Test. Unit tests cover function logic through the isolated worker’s plain classes. Integration tests run locally in CI with the Azure Functions Core Tools (func start) and Azurite for storage, triggered by HTTP or by posting to a local Service Bus emulator. Post-deploy, a step calls the staging slot’s admin/host/status endpoint with the master key from Key Vault to confirm the host loaded all functions before swap; a count mismatch fails the stage.
Troubleshoot. “No functions found” after deploy is the classic symptom and usually means the wrong FUNCTIONS_WORKER_RUNTIME, a missing host.json at the zip root (publish output directory confusion), or an extension bundle mismatch. Slot swap leaving triggers disabled points at WEBSITE_RUN_FROM_PACKAGE not being slot-sticky. Cold-start latency complaints on Consumption after every deployment are expected; Premium with always-ready instances or Flex Consumption always-ready settings addresses it. Functions firing twice after a swap typically mean both slots were listening on the same queue because the staging slot’s trigger setting was not disabled.
Key consideration: deploying a Consumption-plan function without run-from-package can leave the app in a partially updated state during the copy.
43Explain CI/CD for infrastructure in the context of Azure DevOps.
CI/CD for infrastructure treats Bicep, Terraform, ARM or Pulumi definitions like application code: stored in Azure Repos, protected by branch policies, validated on pull request, and applied by pipelines through scoped service connections. The difference from application CI/CD is that the “artifact” is a desired state and the deployment is a plan-then-apply reconciliation against live resources.
A typical pipeline has these phases:
- Validate: lint and format (
bicep build,terraform fmt -check,terraform validate), static policy checks (Checkov, PSRule for Azure, tfsec), and unit tests for modules. - Plan / what-if on PR:
az deployment group what-iforterraform plan -out=tfplan, with the plan published as an artifact and summarised in the PR for reviewers. - Apply per environment in deployment jobs, with the environment’s approval gating production and the plan artifact from the PR stage reused so what was reviewed is exactly what runs.
- Drift detection on a schedule: a plan against each environment that fails if changes are pending.
This diagram shows the flow from pull request to applied infrastructure.

State and identity are the two design decisions: remote state (Terraform) or Azure’s own deployment history (Bicep), and a workload-identity service connection per environment with only the roles the templates need (often Contributor plus User Access Administrator restricted by conditions).
44In a real project using Azure DevOps, how would you apply, test, or troubleshoot CI/CD for infrastructure?
Apply. For a landing zone and workload environments I separate repositories: platform-infra (networking, DNS, policies, applied by a platform pipeline with a subscription-scoped connection) and per-workload infrastructure living alongside the application code so a feature that needs a new queue ships the Bicep in the same PR. Each environment is a deployment job targeting an environment with approvals; production also has a required-template check and branch control on main. Parameter files are per environment and reviewed like code.
Test. PR validation runs bicep build, PSRule for Azure against the compiled ARM, and what-if with results posted as a PR comment via the REST API. For Terraform the plan is run with -detailed-exitcode and a non-zero “changes present” code is expected; a plan showing destroy operations triggers an extra required reviewer. After apply, a verification step queries the resources (az resource list --tag app=orders) and asserts expected counts and SKUs. Weekly drift detection plans every environment and opens a work item when drift appears.
Troubleshoot. what-if noise (reporting changes on every run) usually comes from properties the API normalises, and is handled with --exclude-change-types NoChange Ignore and known-noise filters. AuthorizationFailed on role assignments means the connection identity lacks User Access Administrator. Terraform state lock errors after a cancelled run require terraform force-unlock with the lease ID from the error. Bicep deployments failing with InvalidTemplateDeployment give the inner error in the Azure deployment history, not the pipeline log.
The main consideration is parallel applies: two pipelines touching the same resource group must be serialised with an exclusive-lock check.
45Explain Terraform Bicep in pipelines in the context of Azure DevOps.
Bicep and Terraform are the two mainstream infrastructure languages used from Azure Pipelines; both run through CLI steps or marketplace tasks inside the same stage pattern of validate, plan, apply.
| Aspect | Bicep | Terraform |
|---|---|---|
| State | None; Azure Resource Manager is the state | Remote state file, typically Azure Storage with lease locking |
| Preview | az deployment ... what-if | terraform plan -out=tfplan |
| Authentication in pipeline | AzureCLI@2 with the service connection | ARM_* env vars or OIDC via TerraformTaskV4 / ARM_USE_OIDC |
| Scope | Azure only, day-zero support for new resources | Multi-cloud and SaaS providers, provider lag possible |
| Modules | Bicep registry (ACR) or template specs | Registry or Git modules |
- task: AzureCLI@2
  displayName: Deploy Bicep
  inputs:
    azureSubscription: sc-dev
    scriptType: bash
    scriptLocation: inlineScript
    inlineScript: |
      az deployment group create \
        --resource-group rg-orders-dev \
        --template-file infra/main.bicep \
        --parameters infra/dev.bicepparam \
        --mode Incremental
For Terraform the equivalent is terraform init with backend configuration pointing at a storage account, plan publishing tfplan as an artifact, then apply tfplan in a later deployment job. With a workload-identity service connection the pipeline exports ARM_USE_OIDC=true, ARM_OIDC_TOKEN from $(idToken) or ARM_OIDC_REQUEST_TOKEN, and the client and tenant IDs from the connection, so no secret exists anywhere. Bicep’s absence of state removes a class of problems (locks, corruption) but makes deletions explicit; Terraform’s state enables accurate destroy plans and cross-provider dependencies.
46In a real project using Azure DevOps, how would you apply, test, or troubleshoot Terraform Bicep in pipelines?
Apply. In a programme where the platform team uses Terraform (multi-cloud networking and Entra configuration) and application teams use Bicep (Azure-only workloads), I standardise two templates. The Terraform template runs init with -backend-config for a per-environment state container, plan on PR with the plan uploaded as an artifact, and apply of that same artifact after approval, using ARM_USE_OIDC with the workload-identity connection. The Bicep template compiles, runs what-if, and deploys with .bicepparam files; shared modules come from a Bicep registry in ACR, versioned by tag.
Test. Terraform modules have terraform test cases executed in CI against a sandbox subscription, destroyed afterwards. Bicep modules run bicep lint with a shared bicepconfig.json ruleset and PSRule, and a deployment test to an ephemeral resource group named after the PR, deleted on completion. Both pipelines assert the plan contains no destroys unless a allow-destroy label is on the PR.
Troubleshoot. Terraform Error acquiring the state lock after cancelled runs needs a force-unlock; repeated occurrences mean two pipelines share one state and need an exclusive lock. ARM_OIDC failures (AADSTS70021) indicate the token request step ran outside the AzureCLI@2 context where idToken is available, or the provider version predates OIDC support. Bicep BCP compile errors are deterministic and caught by linting; runtime DeploymentFailed requires az deployment operation group list to find the failing resource. Plan drift between PR and apply (“Saved plan is stale”) means someone applied manually; re-plan and require the exclusive lock.
Key consideration: never run apply without a saved plan, because the live state may have changed since the PR review.
47Explain branch strategy GitFlow trunk based in the context of Azure DevOps.
A branch strategy defines how changes flow from a developer’s workstation to production. Azure Repos supports any Git model; the choice shapes branch policies, pipeline triggers and release cadence.
| Aspect | GitFlow | Trunk-based development |
|---|---|---|
| Long-lived branches | main, develop, plus release/*, hotfix/* | Only main |
| Feature work | Feature branches merged into develop | Short-lived branches (hours to 2 days) merged to main via PR |
| Release | Cut release/x.y, stabilise, merge to main and back to develop | Release from main on every merge or by tag; feature flags hide unfinished work |
| Hotfix | hotfix/* from main, merged both ways | Fix on main, redeploy |
| Suits | Versioned products with support for multiple releases | Continuous delivery of services |
The diagram contrasts the long-lived branch flow of GitFlow with the single-trunk flow of trunk-based development.
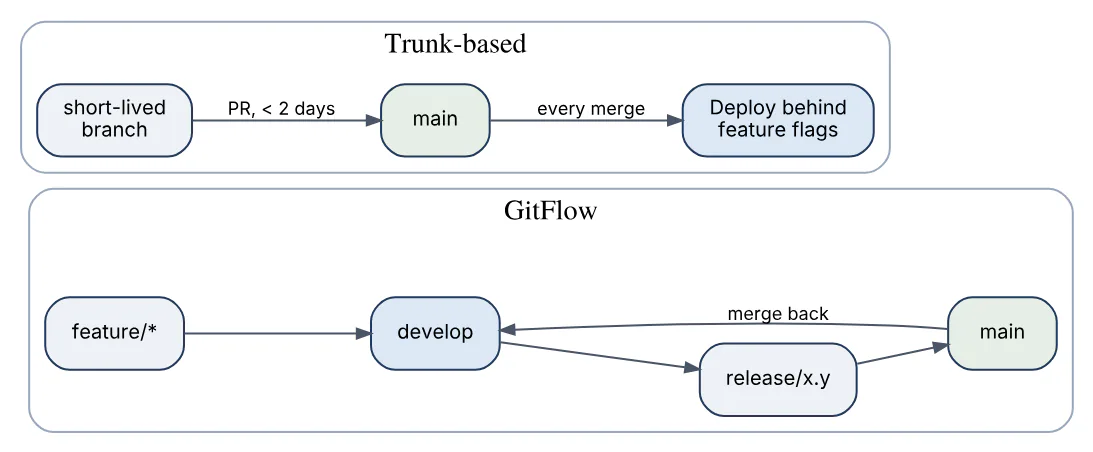
In Azure DevOps terms, GitFlow means policies on main, develop and release/*, pipelines triggered per branch type, and release pipelines per version line; trunk-based means one heavily protected main with fast PR validation, CI on every merge deploying to dev automatically, and environments with approvals for promotion. Trunk-based pairs with the practice of release branches as tags rather than branches, and with feature flags so that merge frequency is decoupled from release decisions. GitFlow’s double merge (release to main and back to develop) is where most of its operational cost sits and where Azure Repos’ “merge conflicts resolved in the web” feature gets used most. Most modern service teams on Azure DevOps run trunk-based with a release branch only when a long support window is contractual.
48In a real project using Azure DevOps, how would you apply, test, or troubleshoot branch strategy GitFlow trunk based?
Apply. For a cloud-hosted SaaS I run trunk-based: main with two-reviewer policy and sub-10-minute validation, every merge deploying to dev, promotion to test and production through the same pipeline run with approvals, and features behind flags. For the on-premises edition of the same product, which customers upgrade yearly, I add release/2026.1 branches cut from main, with cherry-picks via the PR “cherry-pick” action and a pipeline triggered on release/* that produces signed installers. That is a hybrid: trunk for development, release branches only as a support mechanism.
Test. The strategy is tested by metrics rather than tests: lead time from PR open to production, PR size, and the number of branches older than a week, all from Azure DevOps Analytics views on a dashboard. A simulated hotfix drill (fix on main, cherry-pick to the release branch, deploy) confirms the process works before a real incident.
Troubleshoot. The symptom of GitFlow going wrong is develop and main diverging because a hotfix was not merged back; git log main --not develop lists what is missing, and I add a scheduled pipeline that opens a PR automatically when it is non-empty. Trunk-based pain shows as merge conflicts on main because branches lived too long; the fix is smaller stories and stacked PRs rather than more policy. Flaky validation builds push developers to ask for bypass permission, which I decline and instead fix the flakiness.
The consideration is that strategy follows release cadence: forcing GitFlow onto a continuously deployed service adds ceremony with no benefit.
49Explain unit tests and code coverage in the context of Azure DevOps.
Azure Pipelines does not run tests itself; it runs the framework’s test runner and then publishes results and coverage so they appear in the run summary, feed PR status checks and drive policies.
- Test results: the
PublishTestResults@2task accepts JUnit, NUnit, xUnit, VSTest TRX and cTest formats.DotNetCoreCLI@2 testandVSTest@2publish automatically. Results show pass/fail trends, durations, failed-test history and flaky-test detection across runs. - Code coverage:
PublishCodeCoverageResults@2ingests Cobertura or JaCoCo XML (and, in v2, summary files from multiple tools) and renders a Coverage tab with per-file drill-down. Coverage on a PR can be enforced with a build quality policy that fails the status when coverage drops or is below a target. - Test Plans is the separate manual and exploratory testing service; automated test results can be associated with test cases, but unit tests normally stay as pipeline results.
- script: |
    dotnet test --no-build -c Release \
      --collect:"XPlat Code Coverage" \
      --results-directory $(Agent.TempDirectory)/tests
  displayName: Unit tests
- task: PublishCodeCoverageResults@2
  inputs:
    summaryFileLocation: $(Agent.TempDirectory)/tests/**/coverage.cobertura.xml
For JavaScript the pattern is Jest with jest-junit and coverageReporters: ['cobertura']; for Java, Surefire XML plus JaCoCo; for Python, pytest --junitxml and coverage xml. The run’s Tests tab becomes the shared record across languages, which is the point of publishing.
50In a real project using Azure DevOps, how would you apply, test, or troubleshoot unit tests and code coverage?
Apply. For a mixed .NET and TypeScript platform I run unit tests in every PR validation build, publish results and Cobertura coverage from both stacks in the same job, and enable the coverage build-quality policy on main set to “fail if coverage decreases” rather than a fixed number. Integration tests run in the post-merge CI pipeline with a services: container, and the nightly build runs the slow suite with rerunFailedTests enabled in VSTest@2 to separate flaky from broken.
Test. I verify the publishing itself: a deliberately failing test must show on the run summary and block the PR, and the Coverage tab must show per-file numbers rather than only a summary (a sign the source paths matched). The Analytics “Test failures” and “Flaky tests” widgets are reviewed weekly; a test flagged flaky is quarantined with a category and given an owner.
Troubleshoot. A green run with a failing test usually means the test command’s exit code was swallowed (|| true or PowerShell without $LASTEXITCODE handling). Empty Coverage tabs happen when the glob did not match or when the report format is OpenCover rather than Cobertura; coverlet needs --collect:"XPlat Code Coverage" or the coverlet.collector package. “Coverage policy status pending forever” is the policy waiting for a pipeline that no longer publishes coverage. Duplicate test results come from both the CLI task and a separate publish task uploading the same TRX.
Key consideration: coverage thresholds measured on the whole repository punish teams who add tests to legacy code slowly; measuring the diff coverage on the PR is fairer and is what the quality policy does.
51Explain security scans and SAST in the context of Azure DevOps.
Security scanning in Azure Pipelines is implemented as tasks and status checks in the PR and CI flow. Static Application Security Testing (SAST) analyses source for vulnerabilities before anything runs; it sits alongside dependency scanning, secret scanning, infrastructure-as-code scanning and container image scanning.
- GitHub Advanced Security for Azure DevOps adds native code scanning (CodeQL via
AdvancedSecurity-Codeql-Init@1,AdvancedSecurity-Codeql-Analyze@1), dependency scanning (AdvancedSecurity-Dependency-Scanning@1) and secret scanning with push protection on Azure Repos, surfacing alerts in the Repos Advanced Security tab and optionally blocking PRs. - Marketplace and vendor tasks: SonarQube or SonarCloud (
SonarQubePrepare,SonarQubeAnalyze,SonarQubePublish) with a quality-gate status check, Checkmarx, Veracode, Snyk, Mend. - Open-source CLIs run as script steps: Semgrep, Trivy (filesystem, IaC and image scanning), Checkov, Gitleaks, with results converted to SARIF and published with the
PublishSecurityAnalysisLogsor SARIF SAST Scans Tab extension. - Policy enforcement: a PR status policy waits for the scanner’s quality gate; Evaluate artifact checks on environments can block images with critical CVEs.
Results should land in one place that developers see: PR annotations for new findings and a backlog of accepted risks as work items. Scans are tiered: fast incremental SAST and secret scanning on every PR, full CodeQL and dependency review on main, and scheduled deep scans weekly, so security does not add thirty minutes to each pull request.
52In a real project using Azure DevOps, how would you apply, test, or troubleshoot security scans and SAST?
Apply. For a healthcare API I enable GitHub Advanced Security for Azure DevOps on the repository so secret push protection stops credentials at commit time, run CodeQL for C# and JavaScript in the main CI, and run dependency scanning plus Trivy on the container image in the PR build. The Advanced Security alerts policy blocks PR completion on new high-severity alerts. SonarQube remains for code-quality gates; its status check is required on main. Container images are also checked by an Evaluate-artifact environment check that rejects images with critical CVEs older than seven days.
Test. I seed the repository with a known-vulnerable fixture (an intentionally injectable SQL query behind a feature flag, a test package with a published CVE, a fake AWS key pattern) in a throwaway branch and confirm each scanner flags it, then remove the fixture. Scanner versions are pinned and upgraded through the same PR process.
Troubleshoot. CodeQL producing no results for C# generally means the build was not observed: the Init task must run before the compile step, and autobuild or an explicit build between Init and Analyze is required. Dependency scanning missing transitive packages indicates the lock file was absent. SonarQube “quality gate pending” is the webhook from Sonar to Azure DevOps not configured, so the status never arrives. False-positive fatigue is handled by dismissing alerts with a reason in the Advanced Security tab, which is audited, rather than by excluding paths wholesale.
The consideration is scan time on PRs: a full CodeQL analysis can exceed ten minutes on large codebases, which is why it runs post-merge and PRs rely on faster checks.
53Explain pipeline permissions least privilege in the context of Azure DevOps.
Least privilege for pipelines means a run can touch only what its purpose requires: the right repositories, the right resources, and the smallest cloud identity. Azure DevOps provides several controls that have to be combined.
- Job authorization scope: the project setting “Limit job authorization scope to current project for non-release pipelines” makes the build identity
<Project> Build Serviceinstead of the collection-wide one; “Protect access to repositories in YAML pipelines” restrictsSystem.AccessTokento repositories explicitly referenced inresources. - Pipeline resource authorization: service connections, variable groups, secure files, agent pools and environments must be authorized per pipeline rather than “open to all pipelines”, and can carry approvals and checks.
- Service connection scope: one connection per environment and resource group scope with an identity holding only the roles needed; workload identity federation removes stored secrets.
- Build service permissions: the build service account is granted Contribute on a repo only if the pipeline needs to push (tags, version bumps), Create tag otherwise.
- Protected resources via templates: a required-template check guarantees that pipelines using production resources are built from a reviewed skeleton.
- Edit rights: pipeline definitions and YAML on
mainare protected by branch policies, since whoever can edit the YAML can direct the credentials. - Settings hardening: disable classic pipelines, disable “Allow public projects” where not needed, and restrict PAT creation via the Entra tenant policy.
The model treats the pipeline as code with an identity, not as a trusted administrator; the YAML author should never be able to escalate beyond what the resources granted to that pipeline allow.
54In a real project using Azure DevOps, how would you apply, test, or troubleshoot pipeline permissions least privilege?
Apply. For a fintech organization I enable both job-authorization scope restrictions at organization and project level, turn off classic pipelines, and require every service connection, variable group and environment to be authorized explicitly. Production connections use workload identity to a managed identity holding Contributor on one resource group, and are usable only by pipelines passing the required-template and branch-control checks. The project build service identity has Read on repositories and Create tag on the service repo only; pushing version bumps is done by a dedicated pipeline with a narrower scope. Pipeline settings restrict “Set variables at queue time” so nobody injects values into protected runs.
Test. I run a “red team” pipeline from a feature branch that tries to use sc-prod, read payments-prod variables, check out an unrelated repository with System.AccessToken, and deploy to the production environment; each attempt must fail with a clear permission error, and the attempts should appear in the organization audit log. I repeat this quarterly as settings drift.
Troubleshoot. TF401019 or “repository not found” after enabling repository protection means a checkout or git clone used a repo not declared under resources: repositories. “Could not find a service connection” is the per-pipeline authorization, resolved in the Permissions needed banner. Deployments failing in production only after tightening RBAC reveal hidden privileges the pipeline relied on (role assignments, Key Vault access), which the Azure activity log exposes by correlating the connection identity.
Consideration: least privilege is undermined if the same people can edit the template repository and the consumer YAML without review, so the templates repo needs its own strict policies.
55Explain Key Vault integration in the context of Azure DevOps.
Azure Key Vault integration lets pipelines consume secrets, certificates and keys stored in a vault without ever storing them in Azure DevOps. There are three mechanisms:
| Mechanism | How it works | Best for |
|---|---|---|
| Variable group linked to Key Vault | Library group lists secret names; values fetched at run start via a service connection | Reusing the same secrets across many pipelines |
AzureKeyVault@2 task | Fetches selected secrets (or *) into secret pipeline variables inside a job | Per-job, ad-hoc or filtered access |
| Application-side references | App Service / Functions settings use @Microsoft.KeyVault(SecretUri=...); pipeline never sees values | Runtime configuration |
- task: AzureKeyVault@2
  inputs:
    azureSubscription: sc-prod
    KeyVaultName: kv-orders-prod
    SecretsFilter: 'DbPassword,ApiSigningKey'
    RunAsPreJob: false
- script: ./migrate.sh
  env:
    DB_PASSWORD: $(DbPassword)
The service connection identity needs the Key Vault Secrets User RBAC role (or Get and List on an access policy if the vault still uses the legacy model). Fetched values become secret variables: masked in logs, not propagated to environment variables unless mapped, and not available to forked PR builds. The vault’s firewall must allow the agent: for Microsoft-hosted agents either “Allow trusted Microsoft services” plus the task’s behaviour, or a self-hosted agent inside the VNet with a private endpoint. Certificates fetched this way arrive as base64 PFX in a secret variable and are usually written to disk with a short script for signing or TLS tasks.
56In a real project using Azure DevOps, how would you apply, test, or troubleshoot Key Vault integration?
Apply. For a trading platform I keep one vault per environment, kv-trading-dev to kv-trading-prod, each in the environment’s VNet with a private endpoint. The build identity of the self-hosted agents in that VNet has Key Vault Secrets User through the workload-identity service connection, and the pipeline uses AzureKeyVault@2 with an explicit SecretsFilter so only the migration password and signing certificate ever enter the run. Application secrets are never exported; App Service settings reference the vault directly and the app’s managed identity reads them.
Test. A pipeline step echoes ${#DB_PASSWORD} and asserts a non-zero length, and another step tries a secret not in the filter and asserts it is empty, which proves the filter works. Rotation is rehearsed by setting a new version in the vault and confirming the next run picks it up with no pipeline change. Access logs on the vault (diagnostic settings to Log Analytics) confirm that only the expected identities performed SecretGet.
Troubleshoot. Forbidden (403) on fetch with a working connection is RBAC: the identity has Reader on the vault but not Secrets User, or the vault uses access policies and the identity has none. Public network access is disabled means a hosted agent hit a private vault; the fix is a self-hosted agent in the VNet, not opening the firewall. Secrets fetched with * that break tasks often contain multi-line values (certificates) that logging masks partially; filter to what is needed. A linked variable group showing stale values after rotation is a run that started before rotation; values are read at run start.
Key consideration: with RunAsPreJob: true secrets are fetched before any other step, including untrusted scripts from a PR, so leave it false for validation pipelines.
57Explain pipeline artifacts retention in the context of Azure DevOps.
Retention determines how long a pipeline run and everything attached to it (logs, test results, pipeline artifacts published with publish:, symbols) is kept before automatic deletion. It is governed by two layers:
- Project settings, Retention policy (Pipelines section): days to keep runs (default 30), minimum runs to keep per pipeline (default 3), days to keep pull-request runs (default 10), and days to keep runs after a pipeline is deleted. Organization administrators can set bounds for what projects may choose.
- Run-level retention leases: a run can be retained indefinitely manually, by a deployment to an environment (runs that deployed to an environment are kept while that policy applies), or programmatically through the Leases REST API (
POST _apis/build/retention/leases), which is how release pipelines or custom scripts pin a run.
Pipeline artifacts live and die with their run; there is no separate size-based quota, but every retained run holds storage. Separate retention mechanisms exist for Azure Artifacts feeds (package retention policies with promoted-version protection) and for Test Plans test results and attachments (project test retention settings). Classic release pipelines carried their own retention per stage, which is part of why YAML consolidated it.
The design rule: pipeline artifacts are for stage-to-stage hand-off within one run; anything that must be reproducible months later (the exact build deployed to production) should either be pinned with a lease by the production deployment step or pushed to a feed or container registry where retention is explicit.
58In a real project using Azure DevOps, how would you apply, test, or troubleshoot pipeline artifacts retention?
Apply. For a regulated payments platform I set project retention to 30 days with a minimum of five runs per pipeline, PR runs for seven days, and have the production deployment stage call the Leases API to retain the run for 400 days so every deployed build and its logs survive the annual audit.
Container images and NuGet packages are the durable artifacts and carry their own retention in ACR (untagged manifests purged after 30 days, release tags kept) and the feed (promoted versions kept). Nothing important depends on a pipeline artifact older than a run.
Test. The retention lease step is verified by querying GET _apis/build/retention/leases?runId= after a production deployment and asserting a lease exists with the expected validity. A quarterly check lists runs older than the policy to confirm deletion actually occurs, because a very large number of leases can quietly make the policy ineffective. Storage trends are monitored through the organization usage reports.
Troubleshoot. “Artifact not found” when redeploying an old run means it was cleaned up; the fix is leases or moving to a feed, not extending global retention. Runs that never delete despite expiry nearly always have a lease from an environment deployment or a manual “Retain” that someone forgot; the run’s “…” menu lists leases. A sudden storage spike often comes from a pipeline publishing node_modules or test video recordings as artifacts; publish: paths should be narrow. PR runs piling up indicates the PR retention setting is being overridden by the minimum-runs rule.
Key consideration: retention is counted from the run’s creation, not its last download, so a build still in production can expire unless a lease pins it.
59Explain release gates and checks in the context of Azure DevOps.
Gates and checks are automated conditions evaluated before (and optionally after) a deployment stage proceeds. In classic release pipelines they were called gates and ran per stage with re-evaluation intervals; in YAML pipelines the equivalent are checks configured on the protected resources a stage uses: environments, service connections, variable groups, agent pools and secure files.
Available checks:
- Approvals: manual sign-off by users or groups, with instructions, timeout, and the option to require that the requester cannot approve.
- Branch control: only runs from specified branches (and optionally only protected branches) may proceed.
- Business hours: a time window in a time zone.
- Invoke Azure Function and Invoke REST API: call an endpoint and evaluate the response (callback or API response mode), used for change-management tickets, feature-flag states or custom readiness.
- Query Azure Monitor alerts: fail if active alerts exist on a resource group.
- Required template: the pipeline must extend a specific template.
- Evaluate artifact: policy evaluation of container images using a custom policy.
- Exclusive lock: serialise stages that use the resource, with “run latest” or “sequential” behaviour.
Checks have a timeout and a retry interval, so a REST API check can poll a ServiceNow change request every five minutes until it is approved or the timeout elapses. Because they attach to the resource and not the YAML, developers cannot bypass them by editing the pipeline, and the same production environment enforces the same checks for every pipeline that deploys to it.
60In a real project using Azure DevOps, how would you apply, test, or troubleshoot release gates and checks?
Apply. For an airline booking system the production environment carries: approval by the release-management group with a 24-hour timeout; branch control allowing only refs/heads/main; an Invoke REST API check against ServiceNow that passes when the linked change request is in “Implement” state; a Query Azure Monitor check on the production resource group; and an exclusive lock. The service connection sc-prod has the required-template check. Checks are configured once by the platform team and every service’s pipeline inherits them by targeting the environment.
Test. Each check is exercised on the UAT environment with identical configuration pointing at a ServiceNow test instance. A change request in the wrong state must hold the stage with the check’s status visible and then pass once the ticket is moved, confirming the retry interval. An induced alert in UAT must block the Azure Monitor check, and resolving it must let the stage proceed. Timeouts are tested by setting one minute in UAT.
Troubleshoot. A check “waiting” with no visible reason is usually the REST API check in callback mode waiting for a callback the external system never sends; switching to API response mode with a JSON success criterion (eq(root['state'], 'implement')) is more robust. Approvals that nobody receives come from notification settings or a group with external users not licensed. The exclusive lock holding across pipelines is by design; the stage panel shows which run owns it. The Azure Monitor check needs the service connection to have Reader on the resource group.
The important consideration is check sprawl: each check adds minutes and failure modes, so I keep production to the few that map to real controls.
61Explain rollback strategies in the context of Azure DevOps.
Rollback is the planned way to return production to a known-good state when a release misbehaves. Azure Pipelines provides the mechanics; the strategy depends on the deployment pattern and on data compatibility.
- Redeploy a previous run: run the pipeline again for the earlier commit, or in the environment’s deployment history use the earlier run; pipeline retention leases keep those runs available.
- Slot swap back: with App Service or Functions slots, swapping again restores the previous version in seconds because the old code still runs in the staging slot.
- Traffic shift: canary or blue-green rollout reversed by setting weights back on Front Door, Application Gateway, Ingress or a service mesh.
- Kubernetes revision rollback:
kubectl rollout undo deployment/ordersor redeploying the previous image tag through the same manifest task, with Helmhelm rollback. - Feature flag disable: the fastest rollback when the risky change is behind a flag; no deployment needed.
- Infrastructure rollback: reapply the previous Bicep or Terraform commit; destructive changes may require restore from backup instead.
Automation hooks: a deployment job’s on: failure: lifecycle hook can run rollback steps automatically when the deploy hook fails, and a post-deployment Azure Monitor check or smoke-test step can fail the stage so the hook fires. Databases are the limiting factor: schema changes must be expand-and-contract (additive first, remove later) so that the previous application version still works against the new schema, otherwise rollback requires a restore and data loss.
62In a real project using Azure DevOps, how would you apply, test, or troubleshoot rollback strategies?
Apply. For an e-commerce checkout on AKS I deploy with the canary strategy and an on: failure hook that scales the canary to zero and resets Istio weights to the stable version. The pipeline records the previously deployed image tag as a stage output before deploying, so a dedicated Rollback pipeline (manually triggered, parameterised with the environment) can redeploy that exact tag in under two minutes without rebuilding. Database migrations are expand-and-contract with the contract step released one version later. Feature flags in Azure App Configuration cover new checkout behaviours so most “rollbacks” are a flag toggle.
Test. Rollback is rehearsed in UAT every sprint: deploy a build that fails its post-deploy health check and confirm the hook restores traffic within the SLO, then run the Rollback pipeline manually and verify the deployed tag matches the previous release. The database rollback test runs the previous application version against the new schema in a test environment before production deployment is approved.
Troubleshoot. A rollback that fails because the old image is gone means ACR retention purged it; release tags are excluded from purging. helm rollback leaving pods crash-looping usually indicates a ConfigMap or secret changed outside Helm’s release, so configuration must be versioned with the release. Slot swap back serving errors points at the staging slot having been redeployed since. Flag toggles that do not take effect quickly are the configuration refresh interval in the app.
Consideration: rollback restores code, not data; events already processed by the new version may need compensating actions.
63Explain versioning semantic tags in the context of Azure DevOps.
Semantic versioning (MAJOR.MINOR.PATCH, with optional pre-release such as -beta.2 and build metadata) gives every build an identity that consumers can reason about, and Git tags anchor that version to an exact commit. In Azure DevOps the pieces fit together like this:
- Version calculation: tools such as GitVersion or MinVer derive the version from tags and branch names (
release/1.4plus commits since the last tag yields1.4.3), or a pipeline computes it from aversion.jsonplus$(Rev:r). The run’sname:key sets the build number:name: $ (Date:yyyyMMdd)$(Rev:.r). - Stamping:
-p:Version=$(semver)for .NET,npm version --no-git-tag-versionfor Node, image tags for containers (orders:1.4.3plusorders:sha-abc123). - Tagging the commit: a step runs
git tag v1.4.3 && git push origin v1.4.3usingSystem.AccessToken, which requires the build service to have Create tag permission; alternatively the pipeline’s tag sources setting tags on success. - Triggering on tags:
trigger: tags: include: ['v*']builds release pipelines from tags. - Run tags: pipeline runs can also be tagged (
##vso[build.addbuildtag]release) for filtering and forresources: pipelinestriggers.
steps:
- script: |
    VER=$(cat version.json | jq -r .version).$(Build.BuildId)
    echo "##vso[task.setvariable variable=semver;isOutput=true]$VER"
    echo "##vso[build.updatebuildnumber]$VER"
  name: setVersion
Tags make a release reproducible: anyone can git checkout v1.4.3 and get the source for the artifact in production.
64In a real project using Azure DevOps, how would you apply, test, or troubleshoot versioning semantic tags?
Apply. For a suite of NuGet libraries and services I use GitVersion in ContinuousDeployment mode with main producing 1.5.0-ci.42 pre-release builds and a release pipeline that, after approval, tags the commit v1.5.0 and republishes the package to the @release view. Containers receive three tags: the semantic version, the short SHA and latest only on main. Breaking API changes are detected by the Microsoft.DotNet.ApiCompat tool, and a major-version bump is required to merge if the comparison fails.
Test. A pipeline unit check compares the computed version with expectations for branch types: a PR build must have a -PullRequest suffix, a release/1.5 branch must produce 1.5.x, and tagging a commit must produce exactly that version with no suffix. The tag step is tested in a sandbox repository where the build service lacks permission, to confirm the error message is clear, then granted Create tag.
Troubleshoot. GitVersion reporting 0.1.0 on hosted agents is shallow clone: set fetchDepth: 0 on checkout so tags and history are available. Duplicate build numbers fail with “build number already exists” when $(Rev:r) is missing from the name: format. git push of a tag failing with TF401027 is the Create tag permission for the build service identity. Packages rejected with 409 reuse a version because the version did not include the build counter in CI mode.
Important consideration: tags are immutable in meaning, so a tag must never be moved; a bad release gets a new patch version.
65Explain monitoring deployment failures in the context of Azure DevOps.
Monitoring deployment failures covers two layers: the pipeline run itself (did the deployment steps succeed) and the system after deployment (is the new version healthy). Azure DevOps supplies the first and hooks into Azure Monitor for the second.
- Pipeline signals: run and stage status, the environment’s deployment history, failed-task logs, and Analytics views such as pipeline pass rate and duration; notifications send email or Teams/Slack messages on run failure, and service hooks post run-completion events to webhooks, Azure Functions or incident tools.
- Post-deployment verification inside the pipeline: smoke-test steps against health endpoints,
Query Azure Monitor alertschecks, and thepostRouteTraffichook in canary strategies, so the stage fails if the deployment degrades the system. - Azure Monitor correlation: a release annotation in Application Insights (automatic for App Service deployments via the Azure Pipelines task or the REST API) marks the deployment time on charts, so a spike after the marker is easy to attribute.
- Deployment metrics: the four DORA measures (deployment frequency, lead time, change failure rate, time to restore) can be derived from Analytics OData feeds (
Pipelines,PipelineRuns) into Power BI.
The diagram shows a deployment with monitoring feedback into the pipeline.
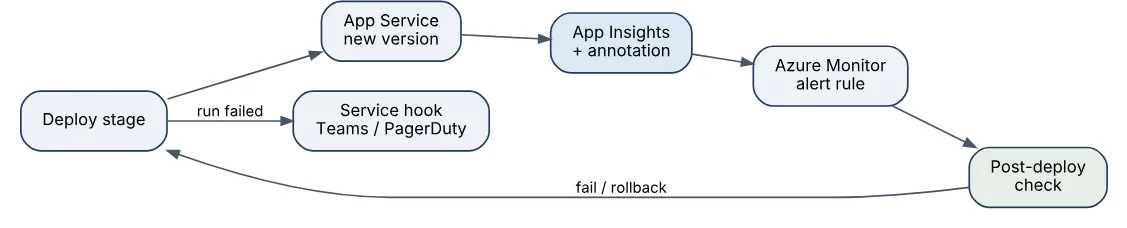
66In a real project using Azure DevOps, how would you apply, test, or troubleshoot monitoring deployment failures?
Apply. For a customer-portal release I wire three feedback loops. A Teams channel receives run-failure notifications filtered to main so noise from feature branches is excluded. The production stage ends with a smoke test and a ten-minute postRouteTraffic wait during which an Azure Monitor check queries failure-rate alerts; a breach fails the stage and runs the rollback hook. Each deployment creates an Application Insights release annotation with the build number, and a Power BI report built on the Analytics OData feed shows change failure rate per service for the monthly review.
Test. I validate the loop end to end in UAT by deploying a build whose health endpoint returns 503 and confirming the stage fails, the hook rolls back, the notification arrives within a minute, and the annotation appears on the Application Insights timeline. Alert rules themselves are tested by firing them with a synthetic metric. The OData query is checked against a hand count of deployments for one week.
Troubleshoot. Notifications that never arrive are usually subscription filters requiring the “pipeline” field to match a renamed pipeline, or Teams connector authentication expired. Missing annotations mean the Application Insights connection string or API key in the annotation step was wrong. Azure Monitor checks passing while the site is clearly failing indicate the alert rule’s evaluation window is longer than the check’s wait. When failures are detected but not attributable, correlating the annotation time with the deployment history and the Build.SourceVersion in the app’s /version endpoint confirms which build is live.
Key consideration: a stage that passes before traffic reaches the new version proves nothing, which is why the post-traffic wait exists.
67Explain pipeline performance optimization in the context of Azure DevOps.
Pipeline performance is about reducing wall-clock time from commit to feedback and from approval to deployment without sacrificing reliability. The main levers in Azure Pipelines:
- Parallelise: split independent work into jobs within a stage, use matrix or slicing for tests, and buy enough parallel jobs so queues do not form.
- Cache:
Cache@2for dependency stores; registry layer caching for Docker builds; self-hosted agents with persistent workspaces for incremental compilation. - Checkout cost:
fetchDepth: 1for shallow clones when history is not needed,checkout: nonein jobs that only consume artifacts, andlfs: falseunless needed. - Avoid repeated work: build once, test and publish with
--no-build, and download only required artifacts (download: currentwithartifact:andpatterns:). - Trigger discipline:
pathsfilters in monorepos,batch: true, and separating fast PR validation from slow nightly suites. - Agent choice: larger self-hosted VMs for CPU-bound builds, Linux instead of Windows where possible (faster startup), and pre-baked images with tools installed instead of installing in every run.
- Fewer steps: each task has start-up overhead; one
scriptstep with several commands beats five tasks. - Measure: the run’s timeline shows step durations; Analytics widgets track duration trends;
system.debugis left off in normal runs because it slows logging.
The usual result of applying these in order (measure, cache, parallelise, trim checkout) is a 50 to 70 percent reduction in typical CI times; the remaining time is usually dominated by the tests themselves, which is a code problem rather than a pipeline problem.
68In a real project using Azure DevOps, how would you apply, test, or troubleshoot pipeline performance optimization?
Apply. A 38-minute PR validation on a .NET and React monorepo was reduced to 9 minutes by: splitting into three parallel jobs (API build and tests, web build and tests, container scan), caching NuGet and the npm store, fetchDepth: 1, moving the 20-minute end-to-end suite to the post-merge pipeline with parallel: 4 sharding, and replacing per-run apt-get install of tooling with a self-hosted scale-set image. Builds run once and downstream steps use --no-build.
Test. Every optimisation is measured by comparing the step timeline before and after over ten runs, since single runs vary with agent and network. A duration-trend widget on the team dashboard shows the P50 and P90 of the validation pipeline, and a failing threshold check in the pipeline itself warns when total time exceeds 12 minutes so regressions are noticed. Correctness is re-verified because caching and sharding can hide tests.
Troubleshoot. A job spending minutes in “Initialize job” is downloading a large number of task versions or waiting for a hosted agent; pinning task major versions helps marginally and more parallel jobs help a lot. Checkout taking several minutes is deep history or LFS; fetchDepth and lfs settings fix it. Caches that never hit are key design errors. Tests taking longer in CI than locally is usually a 2-vCPU hosted agent; a self-hosted 8-vCPU agent or a hosted larger SKU is the fix. Artifacts downloaded repeatedly in every job should be scoped with patterns:.
The consideration is that faster pipelines change behaviour: once validation is under ten minutes developers stop batching commits, which is the real payoff.
69Explain multi-stage release promotion in the context of Azure DevOps.
Multi-stage promotion is the practice of building an artifact once and moving the same artifact through environments (dev, test, staging, production) with increasing scrutiny, rather than rebuilding per environment. In YAML pipelines it is a single pipeline whose deployment stages each target an environment, with dependsOn ordering and conditions.
stages:
- stage: Build
  jobs:
  - job: Build
    steps: [ { publish: out, artifact: drop } ]
- stage: Test
  dependsOn: Build
  jobs:
  - deployment: Deploy
    environment: test
    strategy:
      runOnce:
        deploy:
          steps: [ { template: deploy.yml } ]
- stage: Prod
  dependsOn: Test
  condition: and(succeeded(),
    eq(variables['Build.SourceBranch'], 'refs/heads/main'))
  jobs:
  - deployment: Deploy
    environment: production
    strategy:
      runOnce:
        deploy:
          steps: [ { template: deploy.yml } ]
The diagram shows one artifact built once and promoted through the stages, with approvals guarding production.

Promotion happens inside one run: Build runs first, Test deploys automatically after it (a Dev stage would follow the same pattern), and Production, gated here to the main branch, waits on the environment’s approvals and checks. The same drop artifact (or container image digest) is downloaded in each stage, so what was tested is what ships. Alternatives are a separate release pipeline consuming the build via resources: pipelines with a trigger, which decouples release cadence from CI, and Azure Artifacts views for promoting packages. Environment-specific configuration comes from variable groups or App Configuration, never from rebuilding. Stage-level condition and manual “Run stages” selection allow deploying a hotfix straight to staging without repeating earlier stages.
70In a real project using Azure DevOps, how would you apply, test, or troubleshoot multi-stage release promotion?
Apply. For a loyalty-points service I build a container image once, push it tagged with the semantic version and digest, and the pipeline’s Dev, Test, Staging and Production stages all deploy the same digest through a shared deploy-aks.yml template parameterised by environment name. Dev deploys on every merge; Test runs automated API tests; Staging requires QA approval and runs performance tests; Production has the full check set. Variable groups loyalty-<env> supply configuration; the manifest is rendered with KubernetesManifest@1 bake per environment.
Test. I confirm artifact identity by having every stage log the image digest and the deployed pods’ imageID, and a step asserts they match the Build stage output. The promotion rules are tested by running from a feature branch (Production must be skipped by condition), by failing the Test stage deliberately (Staging must not start), and by using “Run stages” to redeploy Staging alone from an older run (the artifact must still be downloadable thanks to retention leases).
Troubleshoot. A Production stage that deploys different code than Staging means a stage rebuilt or re-pulled latest; digests fix it permanently. Stages running out of order are dependsOn omissions, because stages without dependsOn run in parallel after the first. “Artifact drop not found” in a later stage occurs when download: names a different artifact or when the build job was skipped and download: current has nothing. Approvals requested repeatedly for one run come from several stages targeting the same environment.
Important consideration: environment-specific builds (different compile flags per environment) silently defeat promotion; configuration must be external.
71Explain feature flags and configuration in the context of Azure DevOps.
Azure DevOps has no feature-flag service of its own. Flags and configuration are handled by Azure App Configuration (feature management with filters such as percentage, time window and targeting), by a third-party flag service, or by plain settings, while Azure DevOps supplies the pipeline that deploys the code and pushes the configuration.
The separation that matters is deploy versus release: code ships dark behind a flag, and turning the flag on is a separate, reversible decision that needs no new build.
- Configuration per environment lives outside the artifact: variable groups, Key Vault, or App Configuration keys with labels (
dev,prod). The same build is promoted everywhere. - Pipeline responsibilities: provision the App Configuration store with Bicep, import keys from a versioned file with the
AzureAppConfigurationImport@10task, and optionally snapshot configuration at release time with a snapshot for reproducibility. - Secrets are stored as Key Vault references in App Configuration, so the store holds a pointer rather than the value.
- Pipeline-time flags are different:
parameters, variables and template expressions (${{ if eq(parameters.runPerfTests, true) }}) toggle pipeline behaviour, not application behaviour.
- task: AzureAppConfigurationImport@10
  inputs:
    azureSubscription: sc-prod
    AppConfigurationEndpoint: https://appcs-orders-prod.azconfig.io
    ConfigurationFile: config/prod.json
    Label: prod
    Strict: false
Flag definitions are code-reviewed in the repository and applied by the pipeline, so changes to production behaviour go through the same PR, approval and audit trail as a deployment.
72In a real project using Azure DevOps, how would you apply, test, or troubleshoot feature flags and configuration?
Apply. For a new checkout flow in an e-commerce platform, the code merges to main daily behind a NewCheckout flag in Azure App Configuration. The pipeline imports flags/prod.json after the deployment stage, so enabling the flag for 5 percent of users is a reviewed PR to that file, not a release. Per-environment settings use labels, and Key Vault references carry the payment-provider keys. Stale flags are tracked as work items linked to the feature, and removing the flag is part of the story’s definition of done.
Test. Unit tests cover both flag states through an injected IFeatureManager. A post-deploy pipeline step runs the smoke suite twice, once with the flag forced off and once on, using the targeting filter on a test user. Configuration import is checked by reading back keys with az appconfig kv list --label prod and diffing against the file.
Troubleshoot. A flag that “does nothing” is typically a label mismatch (key exists under dev but the app asks for prod), a cache not yet expired (the provider’s refresh interval, 30 seconds by default in the .NET provider, needs a sentinel key change to trigger), or the app’s managed identity missing the App Configuration Data Reader role. Import failures with Strict: true delete keys not present in the file, which can silently remove a flag. Differences between environments are traced through the snapshot or the key’s revision history.
Important consideration: every flag doubles the test matrix, so flags need an owner and an expiry date or they become permanent branches in the code.
73Explain secrets leakage response in the context of Azure DevOps.
Secrets leakage response is the procedure for when a credential has been exposed in a repository, pipeline log, artifact, variable or chat. The governing principle is that a leaked secret is compromised the moment it was exposed, so revocation comes before cleanup.
The response sequence:
- Contain: revoke or rotate the credential at its source (Key Vault secret, Entra app secret, storage key, PAT, database login), not just in Azure DevOps. For federated service connections there is nothing to rotate, which is a reason to prefer them.
- Assess: determine exposure window and use. Azure DevOps auditing (organization settings, Auditing) records PAT use, permission changes and pipeline edits, and the target service’s sign-in and activity logs show whether the secret was used by anyone unexpected.
- Remove: delete the secret from the current files, and from pipeline run logs and artifacts if they exposed it (delete the runs, or rely on retention). Rewriting Git history (
git filter-repo) is secondary and requires force-push permission and re-cloning by everyone, since forks and clones still hold the secret. - Fix the cause: move the secret to Key Vault, mark variables as secret, or switch to workload identity.
- Prevent: enable secret scanning with push protection through GitHub Advanced Security for Azure DevOps, add a Gitleaks or CredScan step to PR validation, and restrict who can create PATs.
Azure DevOps masks secret variables in logs, but masking is string matching: a transformed value (base64, split across lines) is not masked, so masking is a safety net and not a control.
74In a real project using Azure DevOps, how would you apply, test, or troubleshoot secrets leakage response?
Apply. In a healthcare organisation I keep a runbook with named roles and a one-hour revocation target. When a developer commits a storage account key, the on-call platform engineer rotates the key immediately (regenerating key1 while apps move to key2 or, better, managed identity), queries storage logs for access from unknown IPs across the exposure window, deletes the branch and the runs that echoed it, and opens a security incident work item. Push protection is enabled on all repositories so the same pattern is blocked in future.
Test. Response readiness is exercised in a quarterly drill with a harmless canary credential: a decoy secret planted in a test repository must trigger the scanner alert, and the drill measures time to detect, revoke and confirm. The secret-scanning pipeline step is tested with known patterns (a fake AWS key format) to verify it fails the PR.
Troubleshoot. Typical complications: the secret has been in history for months, so scanning the full history (gitleaks detect on all commits, or Advanced Security’s historical scan) is needed to find sibling leaks. Rotation breaks production because several consumers used the same secret; the dependency list is built from Key Vault access logs and the variable-group usage view. A secret appearing in a log despite masking is usually derived from a masked value (a connection string built from a secret), so each form is added with the ##vso[task.setsecret] logging command. Developers who cloned before cleanup still hold it, which is why revocation is the real fix.
Consideration: rewriting history does not remove a secret from pull request refs (refs/pull/*), which Azure Repos keeps, so those need support-assisted removal and rotation remains essential.
75Explain cross-project templates governance in the context of Azure DevOps.
Cross-project template governance is the practice of centralising pipeline logic in one repository that many projects consume, and controlling who can change it and what it enforces. Azure Pipelines supports this through repository resources that point at a repo in the same or another project, and extends or template references with the @alias suffix.
resources:
  repositories:
  - repository: templates
    type: git
    name: Platform/pipeline-templates   # project/repo
    ref: refs/tags/v3.2.0
extends:
  template: service.yml@templates
  parameters:
    serviceName: orders
Governance mechanisms:
- Ownership and change control: the templates repo has branch policies, CODEOWNERS-style required reviewers (platform team), and semantic version tags that consumers pin; a floating
mainreference is allowed only for internal early adopters. - Enforcement: the Required template check on production environments, service connections and agent pools ensures protected resources are only used by pipelines extending the approved template. Extends templates can restrict step types (
stepListvalidation, forbiddingscriptsteps or untrusted tasks) and inject mandatory steps such as scanning and SBOM generation. - Access: consuming projects need read permission on the templates repository, usually given by making it readable to Project Collection Valid Users, and the project setting for job authorization scope must allow the cross-project checkout.
- Visibility: organization-level pipelines policy settings and a catalogue wiki document available templates and their versions.
Governance trades flexibility for consistency, and the template repo needs a clear escape hatch process, otherwise teams copy templates to work around them.
76In a real project using Azure DevOps, how would you apply, test, or troubleshoot cross-project templates governance?
Apply. In an organisation with sixty services across eight projects, the Platform project owns pipeline-templates. Its extends template contains build, SAST, container scan, SBOM generation and deployment stages; teams supply parameters only. Versions are tagged v3.x; consumers pin the major tag and Dependabot-style automation raises PRs when v4 appears. Production environments and the sc-prod connections carry the required-template check naming service.yml@templates, and a quarterly report lists pipelines not using the template via the Pipelines REST API.
Test. The templates repo’s own pipeline expands several sample consumers using the preview endpoint on every PR and runs one real deployment into a sandbox environment. A contract test confirms that a consumer passing an unexpected step type is rejected by the template’s validation. Breaking changes are announced and released as a new major tag, with the previous major kept alive for a defined period.
Troubleshoot. Could not find repository 'Platform/pipeline-templates' in a consuming project means missing read permission on the repo for that project’s build identity or the wrong alias. “Template not found at ref” is a tag that does not exist or points at a commit without the file. A required-template check failing for a legitimate pipeline reveals the consumer copying service.yml rather than extending it; the failure message shows the template actually used. Unexpected behaviour after a template change affects every consumer on a floating ref, which is why pinning matters.
The key consideration: the template repository is a supply-chain target, so its branch policies must be stricter than any consumer’s.
77Explain repository security policies in the context of Azure DevOps.
Repository security in Azure Repos is a combination of permissions, branch policies and organization-level controls, each addressing a different threat.
- Permissions are set per repository, branch or folder through groups: Read, Contribute, Force push, Bypass policies when pushing or completing PRs, Create branch, Create tag, Manage permissions, Edit policies. The default Contributors group is deliberately denied Force push and bypass on protected branches by explicit settings.
- Branch policies make
mainreachable only through reviewed pull requests with build validation, linked work items, comment resolution, and automatic reviewers by path. Merge type limits keep history clean, and “Reset code reviewer votes on new changes” prevents approving then changing. - Cross-repo policies at project level apply the same protections to all repositories, including new ones, reducing misconfiguration.
- Commit-time controls: Secret push protection and code, dependency and secret scanning through GitHub Advanced Security for Azure DevOps; commit author email validation and file path / name / size restrictions (for example blocking
*.pfx, files over 10 MB) prevent classes of mistakes. - Identity and access: Entra ID conditional access, MFA, and restricted PAT creation; auditing streams to Log Analytics or Sentinel for detection.
- Pipeline interplay: build service identities get the minimum repo permissions, and “Protect access to repositories in YAML pipelines” limits what a pipeline token can read.
The model is defence in depth: policies guard the code, permissions guard the policies, and audit logs prove neither was bypassed. “Bypass policies” is the most sensitive permission and is normally held by nobody except an emergency group.
78In a real project using Azure DevOps, how would you apply, test, or troubleshoot repository security policies?
Apply. For a banking codebase I apply a project-wide cross-repo policy on default branches: two reviewers, author cannot approve own changes, comment resolution, linked work items, and build validation with SAST. Path policies add the security team as a required reviewer for infra/** and **/Auth/**. File policies reject binaries and *.pfx, *.key; push protection is on. The Contributors group has Force push and Bypass explicitly denied, and a break-glass group with bypass rights is empty by default and populated through a time-boxed, audited access request.
Test. A permission matrix test uses accounts for each role: a Contributor must fail to push directly to main, fail to force push, and be blocked by the file-path policy when committing a certificate; a code owner’s approval must be required on an infra/ change. The Effective permissions view (Security, check permissions for a user) is exported and compared with the expected matrix every quarter. Audit log alerts are tested by performing a policy change in a sandbox repo and confirming it reaches the SIEM within minutes.
Troubleshoot. A developer reporting “I can still push to main” is nearly always membership in a group with Bypass (often Project Administrators), visible in Effective permissions. PRs blocked by a reviewer policy that cannot be satisfied (a required group with no active members) need membership fixes, not policy bypass. Build validation that never reports is a pipeline lacking permission or a path filter excluding the PR’s files. Policies silently not applying to a new repository means the cross-repo policy scope pattern does not match its default branch name.
Consideration: strict policies create pressure for bypass, so keep validation fast and the review SLA short, or people will route around the control.
79Explain production incident recovery in the context of Azure DevOps.
Production incident recovery is restoring service quickly when a release or a dependency fails, using Azure DevOps as the controlled path to change. The priority order is restore service, then find the cause, and the fastest safe action is almost always reverting to the last known good state rather than diagnosing in production.
The main recovery routes available through the platform:
- Rollback the release: redeploy the previous build from the environment’s deployment history, swap the App Service slot back, shift traffic away from a canary, or disable a feature flag.
- Hotfix path: a
hotfix/*branch (or a fix onmainin trunk-based development) with an expedited pipeline run that still passes build validation and security scans but skips optional stages through parameters such asskipPerfTests; the production approval is given by an on-call approver rather than bypassed. - Emergency access: a documented break-glass process for permissions, with temporary elevation logged by auditing.
- Coordination: a Boards work item of type Bug or Incident linked to the failing deployment and the fix PR, giving the post-incident review a timeline; service hooks post pipeline events into the incident channel.
- Evidence: the environment’s deployment history, run logs, retained artifacts and Azure Monitor annotations show exactly what changed and when.
After recovery, a blameless review produces actions tracked as work items: add the missing test, tighten a check, improve alerting. The metrics the platform provides (change failure rate, time to restore) tell whether those actions work. Recovery speed depends on decisions made earlier: artifacts retained, rollback automated, database changes backward compatible, and a clear approver for production.
80In a real project using Azure DevOps, how would you apply, test, or troubleshoot production incident recovery?
Apply. For a ticketing platform, a deployment at 14:05 raises the error rate and an Azure Monitor alert pages the on-call engineer. The first action is the parameterised Rollback pipeline, which redeploys the previous image digest recorded by the last successful production stage, finishing in about three minutes. A linked Incident work item records the timeline. The fix is made on a branch, passes the normal validation pipeline, and goes out through the expedited run with approval from the on-call manager; the post-incident review follows within two working days.
Test. Recovery is practised through game days: deliberately deploy a failing build to staging and measure time to detect, time to roll back and whether the runbook was accurate. The Rollback pipeline runs against UAT every sprint so it never rots, and the break-glass access flow is tested quarterly, including confirmation that the elevation expires and appears in the audit log.
Troubleshoot. If rollback fails, the cause is usually that the previous artifact no longer exists (retention or registry purge, solved by retention leases and protected tags), a database migration that is not backward compatible (solved by expand-and-contract and, as a last resort, point-in-time restore), or the production approval waiting on someone unavailable (solved by an on-call approver group with a backup). During the incident, Build.SourceVersion exposed on a /version endpoint confirms which build is live, and the environment’s deployment history identifies what changed and who approved it.
Important consideration: an expedited path must still run the security and build checks; skipping them is how a second incident follows the first.
Answers tailored to your resume and job description
Add your resume and the job description in CrackItX's Settings. When the interviewer asks a Azure DevOps question, Claude suggests an answer using your real projects and the role's requirements, in real time.
See pricing →