Top 50 Kubernetes (K8s)
interview questions
Pods, deployments, services, scheduling, scaling and RBAC. Open a question to read the answer.
01Explain control plane and nodes in the context of Kubernetes (K8s).
A Kubernetes cluster is split into a control plane that makes decisions and worker nodes that run the workloads. The control plane holds the desired state and continuously reconciles the cluster toward it; nodes report their actual state and execute what they are told.
The control plane components are:
- kube-apiserver – the only component everything talks to; validates and persists objects, enforces authentication, authorisation and admission.
- etcd – the consistent key-value store holding all cluster state.
- kube-scheduler – assigns unscheduled Pods to nodes based on resources and constraints.
- kube-controller-manager – runs reconciliation loops (Deployment, ReplicaSet, Node, Job controllers); cloud-controller-manager handles provider integration such as load balancers.
On each node: the kubelet watches the API server for Pods bound to it and drives the container runtime (containerd or CRI-O) through the CRI; kube-proxy (or a CNI replacement such as Cilium) programs Service routing; and the CNI plugin provides Pod networking.
This diagram shows the components and the direction of communication.
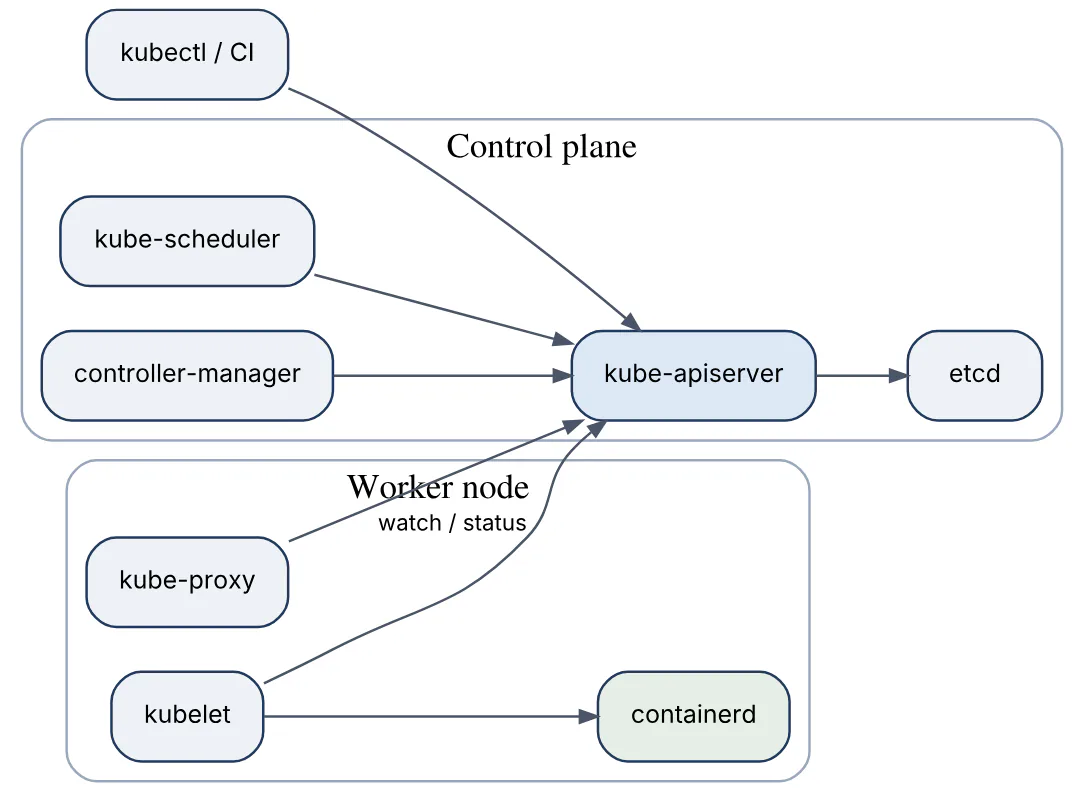
Only the API server writes to etcd; every other component, including the kubelet, is a client of the API server. Managed offerings (EKS, GKE, AKS) hide the control plane entirely and expose only the API endpoint.
02In a real project using Kubernetes (K8s), how would you apply, test, or troubleshoot control plane and nodes?
Apply. For a self-managed cluster running an order-processing platform I would run three control-plane nodes in separate availability zones with stacked etcd, fronted by a load balancer for the API endpoint, and keep workloads off those nodes with the node-role.kubernetes.io/control-plane:NoSchedule taint. Worker nodes would be grouped into pools by purpose (general, memory-heavy batch, GPU) using labels, and provisioned by an autoscaler such as Cluster Autoscaler or Karpenter so that capacity follows demand. On a managed service I would still own the node side: AMI/OS updates, kubelet flags such as --max-pods, and system-reserved resources.
Test. Before go-live I would drain and reboot one control-plane node and confirm kubectl get --raw /readyz?verbose stays healthy and etcd keeps quorum (etcdctl endpoint status). I would also cordon and drain a worker to verify Pods reschedule within the expected time, and run a conformance suite (Sonobuoy) after any infrastructure change.
Troubleshoot. A node going NotReady is the classic symptom. kubectl describe node shows conditions (MemoryPressure, DiskPressure, PIDPressure) and the last heartbeat; on the host, journalctl -u kubelet usually points at a certificate rotation failure, a runtime crash, or the disk filling with images. For API latency, kube-apiserver metrics such as apiserver_request_duration_seconds and etcd backend_commit_duration_seconds distinguish a slow store from an overloaded server.
The common mistake is sizing control-plane disks for capacity rather than IOPS; etcd is latency-sensitive and a slow disk makes the whole cluster feel broken.
03Explain pods deployments replica sets in the context of Kubernetes (K8s).
A Pod is the smallest deployable unit: one or more containers that share a network namespace (one IP, localhost between them), storage volumes and a lifecycle. Pods are ephemeral; when one dies it is not repaired but replaced.
A ReplicaSet keeps a specified number of identical Pods running, selecting them by labels and creating or deleting Pods to match replicas. You almost never write one directly.
A Deployment manages ReplicaSets. It owns the Pod template and, when the template changes, creates a new ReplicaSet and shifts replicas from the old one to the new one according to the update strategy. That layering is what gives rolling updates, rollback and revision history.
apiVersion: apps/v1
kind: Deployment
metadata: { name: checkout }
spec:
  replicas: 3
  selector: { matchLabels: { app: checkout } }
  template:
    metadata: { labels: { app: checkout } }
    spec:
      containers:
        - name: api
          image: registry.example.com/checkout:1.8.2
          ports: [{ containerPort: 8080 }]
The relationship is strictly hierarchical.
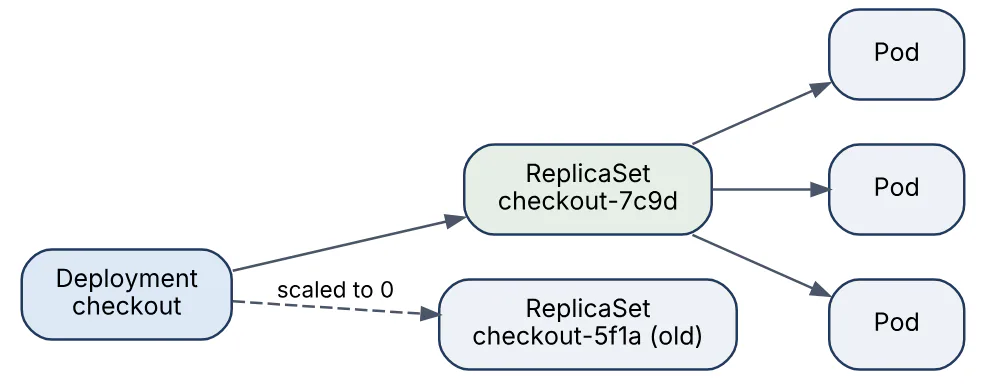
Since Kubernetes 1.29 (GA in 1.33) init containers with restartPolicy: Always act as native sidecars that start before and stop after the main containers.
04In a real project using Kubernetes (K8s), how would you apply, test, or troubleshoot pods deployments replica sets?
Apply. Every stateless service in a payments platform would be a Deployment with at least two replicas, a topologySpreadConstraints rule across zones, explicit resource requests, and revisionHistoryLimit: 5 so old ReplicaSets do not accumulate. Labels follow the app.kubernetes.io/* convention so selectors, NetworkPolicies and dashboards share one vocabulary. The image tag is always an immutable digest or version, never latest, because a Deployment only rolls when the template actually changes.
Test. In CI I would render the manifests and run kubectl apply --dry-run=server plus a schema check (kubeconform), then deploy to an ephemeral namespace and wait on kubectl rollout status deployment/checkout --timeout=120s. A smoke test hits the Service and asserts the new version string. I would also kill a Pod with kubectl delete pod in staging to confirm the ReplicaSet replaces it and traffic is unaffected.
Troubleshoot. When replicas stay below the target, kubectl get rs shows whether the new ReplicaSet is creating Pods at all; kubectl describe pod reveals Pending reasons (insufficient CPU, unsatisfied affinity, a missing PVC) and kubectl get events --sort-by=.lastTimestamp surfaces admission denials. A Deployment that appears stuck is often a selector or label typo: the new ReplicaSet has 0/3 because the Pods fail validation, or the old one never scales down because maxUnavailable: 0 and the new Pods never pass readiness.
The important consideration is that changing spec.selector on an existing Deployment is immutable; a selector change means delete and recreate, which must be planned, not discovered in production.
05Explain services ClusterIP NodePort LoadBalancer in the context of Kubernetes (K8s).
A Service gives a stable virtual IP and DNS name to a changing set of Pods selected by labels, and load-balances connections across the ready endpoints (tracked in EndpointSlice objects). The type field decides how far that address is exposed.
| Type | Reachable from | How it works | Typical use |
|---|---|---|---|
| ClusterIP (default) | Inside the cluster only | Virtual IP programmed by kube-proxy / CNI | Service-to-service traffic |
| NodePort | Any node IP on a port 30000–32767 | Builds on ClusterIP, opens port on every node | Bare-metal, dev, external LB backend |
| LoadBalancer | Internet or VPC via cloud LB | Builds on NodePort, cloud-controller provisions LB | Public entry point per service |
Two further variants matter: ExternalName returns a CNAME to an outside host, and a headless Service (clusterIP: None) returns the Pod IPs directly, which StatefulSets rely on.
apiVersion: v1
kind: Service
metadata: { name: checkout }
spec:
  type: ClusterIP
  selector: { app: checkout }
  ports:
    - port: 80          # Service port
      targetPort: 8080  # container port
A LoadBalancer per service is expensive and leaks cloud resources; the usual production pattern is a handful of LoadBalancer Services in front of an Ingress or Gateway, with everything else ClusterIP.
06In a real project using Kubernetes (K8s), how would you apply, test, or troubleshoot services ClusterIP NodePort LoadBalancer?
Apply. In a microservice e-commerce stack every internal API gets a ClusterIP Service named after the workload so callers use http://inventory.shop.svc. External traffic enters through one LoadBalancer Service bound to the Gateway or ingress controller, annotated for an internal LB where only the VPC should reach it. NodePort appears only in on-prem clusters where MetalLB is unavailable, or as the target of an external hardware balancer. For latency-sensitive calls I set trafficDistribution: PreferClose (GA in 1.33) so traffic stays in-zone when endpoints exist there, and internalTrafficPolicy: Local for node-local agents.
Test. From a debug Pod (kubectl run tmp --rm -it --image=busybox) I resolve the name and curl the ClusterIP, then check kubectl get endpointslices -l kubernetes.io/service-name=checkout lists exactly the ready Pods. For a LoadBalancer I verify the external IP appears in status.loadBalancer and run a short load test to confirm connections spread across backends, not just the first.
Troubleshoot. “Connection refused” against a Service with no endpoints almost always means the selector does not match Pod labels or the Pods are not Ready; kubectl describe svc shows the endpoint list. A reachable Service with timeouts points at targetPort mismatching the container port, or a NetworkPolicy. For a LoadBalancer stuck <pending>, the cloud-controller-manager logs or quota limits explain it. externalTrafficPolicy: Local preserves client IPs but returns errors from nodes without a local Pod, so health checks must be configured accordingly.
Services load-balance TCP connections, not HTTP requests; long-lived gRPC connections will pin to one Pod unless a client-side or proxy balancer is used.
07Explain ingress controllers and gateway API in the context of Kubernetes (K8s).
Both solve the same problem, routing external HTTP(S) traffic to Services based on host and path, but they are different generations of API.
Ingress (networking.k8s.io/v1) is a single resource describing rules; an ingress controller (NGINX, Traefik, HAProxy, cloud-native ones such as ALB) watches those resources and configures a proxy. The spec is deliberately minimal, so anything beyond host/path routing and TLS termination (rewrites, timeouts, canary weights) lives in vendor annotations that are not portable. The Ingress API is frozen: it is stable but receives no new features.
Gateway API (GA since v1.0, installed as CRDs from the gateway.networking.k8s.io group) splits the model into role-oriented resources:
GatewayClass– the implementation, owned by the platform or vendor.Gateway– a listener (ports, TLS, hostnames), owned by cluster operators.HTTPRoute,GRPCRoute,TLSRoute,TCPRoute– routing rules owned by application teams, attached to a Gateway, possibly across namespaces.
apiVersion: gateway.networking.k8s.io/v1
kind: HTTPRoute
metadata: { name: checkout, namespace: shop }
spec:
  parentRefs: [{ name: public-gw, namespace: infra }]
  hostnames: ["shop.example.com"]
  rules:
    - matches: [{ path: { type: PathPrefix, value: /checkout } }]
      backendRefs:
        - { name: checkout, port: 80, weight: 90 }
        - { name: checkout-canary, port: 80, weight: 10 }
Header matching, traffic splitting, request mirroring and cross-namespace delegation are first-class fields rather than annotations. For new platforms Gateway API is the recommended direction; Ingress remains supported and is fine where its feature set is enough.
08In a real project using Kubernetes (K8s), how would you apply, test, or troubleshoot ingress controllers and gateway API?
Apply. For a multi-team SaaS platform I would deploy one Gateway implementation (Envoy Gateway, Cilium, Istio, or the cloud provider’s) with a Gateway in an infra namespace terminating TLS with certificates from cert-manager. Each product team owns HTTPRoutes in its own namespace, and the Gateway’s allowedRoutes restricts attachment to namespaces labelled gateway-access=true. Canary releases use weighted backendRefs; legacy apps that still ship an Ingress keep working on the controller’s Ingress support until migrated with ingress2gateway.
Test. A route is healthy when its status.parents[].conditions show Accepted=True and ResolvedRefs=True; a CI step asserts that after apply. End-to-end I curl the hostname with --resolve pointing at the Gateway address, check TLS chain and expected backend version header, and run a 90/10 split test counting responses. For Ingress, kubectl describe ingress must show an address and the backend list.
Troubleshoot. A 404 from the proxy means the route did not attach or hostnames do not match the listener: check the ResolvedRefs reason (RefNotPermitted for cross-namespace without a ReferenceGrant). 503s mean the backend Service has no ready endpoints. For Ingress, conflicting rules from two resources claiming the same host silently merge or override, so I grep all Ingresses for the host. Controller logs and access logs with request IDs tie a failing request to a backend.
The key consideration is that advanced behaviour still depends on the implementation’s conformance profile; verify a feature is in the Standard channel before building on it.
09Explain configmaps and secrets in the context of Kubernetes (K8s).
Both decouple configuration from container images by storing key-value data that Pods consume as environment variables, command arguments or mounted files. A ConfigMap holds non-sensitive settings (feature flags, URLs, whole config files). A Secret holds credentials, tokens and TLS material; it is base64-encoded in the API, stored separately in etcd, and only sent to nodes that run a Pod referencing it.
| Aspect | ConfigMap | Secret |
|---|---|---|
| Content | Plain text, up to 1 MiB | Base64-encoded bytes, typed (Opaque, kubernetes.io/tls, …) |
| Protection | None | RBAC, optional encryption at rest, tmpfs mount on nodes |
| Mounted as file | Updated in place (eventually) | Same, unless subPath is used |
apiVersion: v1
kind: Secret
metadata: { name: db-credentials }
type: Opaque
stringData:          # plain text in the manifest; API stores it base64
  username: orders_app
  password: s3cr3t-rotate-me
---
env:                 # consumed in the Pod spec
  - name: DB_PASSWORD
    valueFrom:
      secretKeyRef: { name: db-credentials, key: password }
Base64 is encoding, not encryption; anyone who can get secrets can read the values. Real protection comes from RBAC, enabling EncryptionConfiguration (AES-GCM or KMS) on the API server, and the immutable: true flag to prevent accidental edits. Environment variables are fixed at container start, whereas mounted volumes refresh when the object changes.
10In a real project using Kubernetes (K8s), how would you apply, test, or troubleshoot configmaps and secrets?
Apply. In a reporting service I keep application settings in a ConfigMap mounted as /etc/app/config.yaml and the database password and API keys in Secrets that are not committed to Git at all. The source of truth is a cloud secret manager; External Secrets Operator or the Secrets Store CSI driver syncs them into the namespace, so rotation happens upstream. Alternatively Sealed Secrets or SOPS keeps encrypted values in the repo for a GitOps flow. Config changes trigger a rollout by hashing the ConfigMap into a Pod annotation (Helm checksum/config or Kustomize configMapGenerator, which appends a content hash to the name).
Test. A deployment test execs into the Pod and asserts cat /etc/app/config.yaml matches the rendered value and that env | grep DB_ shows no plain password in logs. In staging I rotate a Secret and confirm the application picks up the file-mounted value within the kubelet sync period (about a minute) or restarts if it reads env vars. A policy check (Kyverno or ValidatingAdmissionPolicy) rejects Pods that reference Secrets with latest -style names outside the allowed list.
Troubleshoot. CreateContainerConfigError means the referenced ConfigMap or Secret or key does not exist in that namespace; kubectl describe pod names it. An app not seeing a config change is usually consuming env vars or a subPath mount, both of which never refresh. Wrong credentials after rotation often trace back to a stale cached value in the application rather than Kubernetes.
The trap is granting list secrets cluster-wide to a CI service account; it turns every leaked token into full credential exposure.
11Explain namespaces and RBAC in the context of Kubernetes (K8s).
Namespaces partition a single cluster into virtual sub-clusters. Names of namespaced objects (Pods, Services, Secrets) only need to be unique within their namespace; cluster-scoped objects (Nodes, PersistentVolumes, StorageClasses, ClusterRoles) sit outside any namespace. Namespaces are the unit for ResourceQuota, LimitRange, NetworkPolicy and most authorisation. default, kube-system, kube-public and kube-node-lease exist in every cluster.
RBAC (role-based access control) is the authoriser that decides whether an authenticated subject may perform a verb on a resource. It is built from four objects:
Role– rules (verbs × resources × apiGroups) scoped to one namespace.ClusterRole– the same, cluster-wide or reusable across namespaces.RoleBinding– grants a Role or ClusterRole to subjects within a namespace.ClusterRoleBinding– grants a ClusterRole everywhere.
apiVersion: rbac.authorization.k8s.io/v1
kind: Role
metadata: { name: deployer, namespace: shop }
rules:
  - apiGroups: ["apps"]
    resources: ["deployments"]
    verbs: ["get", "list", "update", "patch"]
---
apiVersion: rbac.authorization.k8s.io/v1
kind: RoleBinding
metadata: { name: ci-deployer, namespace: shop }
subjects: [{ kind: ServiceAccount, name: ci, namespace: shop }]
roleRef: { kind: Role, name: deployer, apiGroup: rbac.authorization.k8s.io }
RBAC is purely additive; there are no deny rules, so the absence of a permission is the deny. Built-in ClusterRoles view, edit, admin and cluster-admin cover most human access needs.
12In a real project using Kubernetes (K8s), how would you apply, test, or troubleshoot namespaces and RBAC?
Apply. For a company with several product teams sharing clusters I would give each team one namespace per environment (payments-dev, payments-prod), created by a platform controller or Terraform together with a ResourceQuota, a LimitRange, a default-deny NetworkPolicy and Pod Security labels. Human access maps OIDC groups to the built-in edit role in their namespaces via RoleBindings and to view cluster-wide; nobody holds cluster-admin interactively. CI pipelines get narrow Roles like the deployer above. Cross-cutting tools (ingress, monitoring) live in platform namespaces with their own ClusterRoles.
Test. kubectl auth can-i create deployments -n payments-prod --as=system:serviceaccount:payments-prod:ci runs in the pipeline for both expected allows and expected denies. kubectl auth can-i --list --as=<user> is reviewed during access audits. Tools such as rbac-lookup or kubectl-who-can answer “who can read Secrets in prod?” and the answer should be a very short list.
Troubleshoot. Error from server (Forbidden) messages name the user, verb, resource and namespace; most are a binding in the wrong namespace, a Role missing the API group ("" for core vs apps), or a subresource such as pods/log or deployments/scale not listed. Enabling audit logging with RequestResponse level for Forbidden responses shows what automated clients are actually attempting. Over-permissioned subjects are found by diffing granted verbs against audit-log usage.
The important consideration is that wildcards (*) in Roles and escalate / bind / impersonate verbs let a subject grant itself more power, so policy should reject them outside platform namespaces.
13Explain service accounts in the context of Kubernetes (K8s).
A ServiceAccount is the identity a Pod (or any in-cluster process) uses when it calls the Kubernetes API, as opposed to a user identity provided by an external identity provider. Every namespace has a default ServiceAccount, and a Pod runs as it unless spec.serviceAccountName says otherwise.
How it works since Kubernetes 1.24:
- No long-lived Secret token is created automatically. The kubelet requests a bound, time-limited token from the API server’s TokenRequest API and projects it into the Pod at
/var/run/secrets/kubernetes.io/serviceaccount/token, rotating it before expiry. - The token is a JWT whose audience, expiry and Pod binding are checked; stolen tokens stop working when the Pod is deleted.
- Permissions come solely from RBAC bindings whose subject is
system:serviceaccount:<namespace>:<name>. automountServiceAccountToken: falseon the ServiceAccount or Pod prevents mounting the token into workloads that never talk to the API.
apiVersion: v1
kind: ServiceAccount
metadata:
  name: inventory-sync
  namespace: shop
  annotations:
    eks.amazonaws.com/role-arn: arn:aws:iam::123456789012:role/inventory-sync
automountServiceAccountToken: false
The same identity extends outside the cluster: the cluster’s OIDC issuer lets cloud IAM (AWS IRSA/Pod Identity, GKE Workload Identity, Azure Workload Identity) trust the projected token, so Pods obtain cloud credentials without static keys. kubectl create token inventory-sync --duration=10m mints a short-lived token for debugging or CI.
14In a real project using Kubernetes (K8s), how would you apply, test, or troubleshoot service accounts?
Apply. Each workload in an order platform gets its own ServiceAccount, even if it needs no API access, because the name becomes the identity for RBAC, cloud IAM and NetworkPolicy-aware service meshes. The ServiceAccount is created by the same Helm chart as the Deployment, automountServiceAccountToken defaults to false, and only operators or controllers that genuinely watch the API (a queue autoscaler, a config reloader) opt in with a narrowly scoped Role. For S3 or Pub/Sub access I annotate the ServiceAccount for workload identity so the Pod exchanges its projected token for cloud credentials; no access keys appear anywhere.
Test. An integration test runs a Pod with the ServiceAccount and calls kubectl auth can-i --list from inside using the mounted token, asserting the list matches the intended permissions. For cloud identity I exec aws sts get-caller-identity (or the GCP equivalent) and check the assumed role. Policy tests assert that the default ServiceAccount has no RoleBindings and that no Pod runs with it in production namespaces.
Troubleshoot. 401 Unauthorized from the API with a valid-looking token usually means a stale legacy Secret token or a token minted for a different audience; 403 Forbidden names the system:serviceaccount:ns:name subject so the fix is an RBAC binding. Cloud credential failures (WebIdentityErr, AccessDenied) trace to a mismatch between the IAM trust policy’s subject string and the actual namespace/name, or a missing OIDC provider registration. kubectl describe pod shows whether the token volume was projected at all.
The common mistake is sharing one ServiceAccount across a namespace, which makes least privilege impossible and audit logs useless.
15Explain readiness liveness startup probes in the context of Kubernetes (K8s).
Probes are health checks the kubelet runs against each container, and each type answers a different question and triggers a different action.
| Probe | Question answered | On failure |
|---|---|---|
| Startup | Has the app finished booting? | Keep waiting; other probes paused |
| Readiness | Can it serve traffic right now? | Remove Pod from Service endpoints |
| Liveness | Is it alive or wedged? | Kill and restart the container |
Each probe can be httpGet, tcpSocket, exec or grpc, with initialDelaySeconds, periodSeconds (default 10), timeoutSeconds (default 1), failureThreshold (default 3) and successThreshold.
containers:
  - name: api
    startupProbe:
      httpGet: { path: /healthz, port: 8080 }
      failureThreshold: 30     # up to 30 x 5s = 150s to start
      periodSeconds: 5
    readinessProbe:
      httpGet: { path: /ready, port: 8080 }
      periodSeconds: 5
    livenessProbe:
      httpGet: { path: /healthz, port: 8080 }
      periodSeconds: 10
      timeoutSeconds: 2
Readiness should reflect dependencies the Pod cannot serve without (database connection, warmed cache); liveness should check only the process itself, never downstream systems, otherwise a database outage makes Kubernetes restart every healthy frontend. The startup probe exists so slow-starting applications do not need an inflated initialDelaySeconds on liveness that would also delay detection of real hangs later.
16In a real project using Kubernetes (K8s), how would you apply, test, or troubleshoot readiness liveness startup probes?
Apply. For a Java catalog service that takes 40–90 seconds to warm caches I give it a startup probe with a generous failureThreshold, a readiness endpoint that returns 503 until the cache is loaded and the database pool is connected, and a liveness endpoint that only confirms the HTTP server thread responds. Readiness is also wired to graceful shutdown: on SIGTERM the app flips /ready to failing, keeps serving in-flight requests for the terminationGracePeriodSeconds window, and exits, so the rolling update drains cleanly. Batch workers that expose no HTTP port use an exec probe that checks a heartbeat file’s age.
Test. In staging I pause the database with a NetworkPolicy and confirm Pods leave the endpoints (kubectl get endpointslices) without restarting (kubectl get pods restart count unchanged). I inject a deadlock with a debug endpoint to confirm liveness restarts the container within periodSeconds × failureThreshold. A load test during a rollout verifies zero 5xx, which proves readiness and preStop timing are right.
Troubleshoot. Restart loops with Liveness probe failed in events but a healthy application log point to timeoutSeconds too tight under load or the probe hitting an endpoint that does heavy work; kubectl describe pod shows the HTTP status or timeout. Pods Running but 0/1 Ready indefinitely usually have a readiness path typo or port mismatch. Mass restarts during an incident indicate liveness is checking a dependency.
The key consideration is that probes consume CPU from the container’s own limit, so expensive exec probes on throttled Pods can themselves cause the failures they detect.
17Explain resource requests and limits in the context of Kubernetes (K8s).
Requests are what a container is guaranteed and what the scheduler uses to place a Pod; a node is only eligible if its allocatable capacity minus the sum of existing requests covers the new Pod. Limits are the ceiling enforced at runtime by the kernel: CPU above the limit is throttled by the CFS quota, memory above the limit causes the container to be OOM-killed.
resources:
  requests: { cpu: "250m", memory: "256Mi" }
  limits:   { cpu: "1",    memory: "512Mi" }
The combination determines the Pod’s QoS class, which decides eviction order under node pressure:
- Guaranteed – requests equal limits for every container; evicted last.
- Burstable – at least one request set, not all equal to limits.
- BestEffort – nothing set; first to be evicted.
Common guidance: always set memory requests equal to limits (memory is not compressible, and overcommitting it causes OOM kills), set CPU requests from observed usage, and consider omitting CPU limits for latency-sensitive services because throttling adds tail latency even when the node has spare cores. LimitRange sets namespace defaults for containers that omit values; ResourceQuota caps the namespace total. Since Kubernetes 1.33 in-place Pod resize (beta, enabled by default) lets requests and limits change without recreating the Pod, which the Vertical Pod Autoscaler can use.
18In a real project using Kubernetes (K8s), how would you apply, test, or troubleshoot resource requests and limits?
Apply. Across a cluster hosting dozens of services I would enforce a LimitRange per namespace so no container lands as BestEffort, and run Vertical Pod Autoscaler in recommendation mode to feed real p95 usage into the manifests every sprint. Databases and caches run as Guaranteed; web APIs run Burstable with memory requests equal to limits and CPU requests at roughly observed p90, no CPU limit. Namespace ResourceQuotas stop one team starving the rest, and the cluster autoscaler reads requests, so inflated requests directly inflate the cloud bill.
Test. A load test runs while kubectl top pods and container_cpu_cfs_throttled_periods_total from cAdvisor are watched; throttling above a few percent during a latency SLO breach means the CPU limit is too low. I also deploy with intentionally tiny memory limits in a sandbox to confirm the application’s OOM behaviour (fast crash, not slow swap-like degradation) and that alerts on OOMKilled fire.
Troubleshoot. Pending with Insufficient cpu means requests, not usage, exhausted the node; kubectl describe node shows allocated percentages that are often far above actual utilisation. OOMKilled with exit code 137 in kubectl describe pod is a memory limit hit, frequently a JVM whose heap flags ignore the cgroup limit (use -XX:MaxRAMPercentage). Node-level evictions appear as Evicted Pods with the reason in events, and BestEffort Pods go first.
The common mistake is copying limits from an example file: a 100m CPU limit on a Node.js service produces multi-second latency spikes that look like network problems.
19Explain HPA autoscaling in the context of Kubernetes (K8s).
The HorizontalPodAutoscaler (autoscaling/v2) adjusts the replica count of a Deployment, StatefulSet or any scalable resource to keep an observed metric near a target. Every 15 seconds (the controller’s sync period) it computes desiredReplicas = ceil(currentReplicas × currentMetric /targetMetric) for each metric and takes the highest result, bounded by minReplicas and maxReplicas.
Metric sources:
- Resource – CPU or memory from the Metrics Server, expressed as utilisation of the request.
- Pods / Object – custom metrics via an adapter (Prometheus Adapter), such as requests per second or queue depth.
- External – metrics from outside the cluster, such as an SQS queue length.
apiVersion: autoscaling/v2
kind: HorizontalPodAutoscaler
metadata: { name: checkout }
spec:
  scaleTargetRef: { apiVersion: apps/v1, kind: Deployment, name: checkout }
  minReplicas: 3
  maxReplicas: 30
  metrics:
    - type: Resource
      resource:
        name: cpu
        target: { type: Utilization, averageUtilization: 70 }
  behavior:
    scaleDown:
      stabilizationWindowSeconds: 300
      policies: [{ type: Percent, value: 20, periodSeconds: 60 }]
Scale-up is immediate; scale-down waits through the stabilisation window (default 300 seconds) to avoid flapping. HPA changes replicas, VPA changes per-Pod resources, and the Cluster Autoscaler or Karpenter adds nodes when HPA-created Pods cannot be scheduled; the three are complementary. KEDA builds on HPA to add event-driven scaling, including to zero.
20In a real project using Kubernetes (K8s), how would you apply, test, or troubleshoot HPA autoscaling?
Apply. For a checkout API with a daily peak I would scale on CPU utilisation at 65–70% of request plus a custom http_requests_in_flight per Pod metric via Prometheus Adapter, because CPU alone reacts late for I/O-bound services. minReplicas covers the baseline with one zone lost; maxReplicas is capped by the downstream database’s connection budget. For queue consumers I would use KEDA with an SQS scaler so idle periods scale to zero. The HPA and the Deployment must not both own replicas: the Deployment manifest omits it (or Helm/Argo ignores the field) so a GitOps sync does not fight the autoscaler.
Test. I generate load with k6 and watch kubectl get hpa -w and kubectl describe hpa to see the computed metric, the chosen replica count and events. Assertions: scale-up begins within two sync periods, p95 latency stays within SLO throughout, and scale-down after the test respects the stabilisation window. I also verify the cluster autoscaler adds nodes fast enough; otherwise the HPA’s new Pods sit Pending.
Troubleshoot. <unknown>/70% in kubectl get hpa means metrics are missing: Metrics Server is down, or a container lacks a CPU request, which makes utilisation undefined for the whole Pod. Constant flapping points to a target too close to steady-state usage or a metric that drops the moment replicas increase (per-Pod RPS); behavior policies dampen it. Stuck at maxReplicas with high latency usually means the bottleneck is downstream, not the Pods.
The important consideration is that HPA cannot react faster than the application starts; slow startup needs higher minReplicas or predictive scaling.
21Explain statefulsets and daemonsets in the context of Kubernetes (K8s).
Both are workload controllers for cases a Deployment handles badly.
A StatefulSet manages Pods that need a stable identity. Each Pod gets an ordinal name (kafka-0, kafka-1), a stable DNS entry through a headless Service (kafka-0.kafka.msg.svc), and its own PersistentVolumeClaim created from volumeClaimTemplates that follows the Pod across rescheduling.
Pods are created and scaled down in order (unless podManagementPolicy: Parallel) and updated one at a time from the highest ordinal, with partition allowing staged rollouts. Deleting the StatefulSet leaves the PVCs behind by default; persistentVolumeClaimRetentionPolicy (GA in 1.32) can change that. Typical users: databases, message brokers, consensus systems such as ZooKeeper or etcd.
A DaemonSet runs exactly one Pod on every node (or every node matching a nodeSelector /affinity), adding a Pod automatically when a node joins and removing it when it leaves. It bypasses normal scheduling constraints by tolerating many taints. Typical users: log shippers (Fluent Bit), node monitoring (node-exporter), CNI and CSI node agents, security sensors.
| Aspect | StatefulSet | DaemonSet |
|---|---|---|
| Replica count | Explicit replicas | One per matching node |
| Pod identity | Stable ordinal name and PVC | Named after node, no stable storage |
| Scaling trigger | Manual or HPA | Nodes joining or leaving |
| Update order | Reverse ordinal, one at a time | Rolling across nodes, maxUnavailable |
Neither should be chosen for ordinary stateless services; the Deployment’s flexibility and speed is lost.
22In a real project using Kubernetes (K8s), how would you apply, test, or troubleshoot statefulsets and daemonsets?
Apply. Running Kafka in-cluster for an event pipeline, I would use a StatefulSet (usually through the Strimzi operator) with a headless Service, volumeClaimTemplates on an SSD StorageClass, podAntiAffinity so brokers land on different nodes, and a PodDisruptionBudget of maxUnavailable: 1. Broker config references peers by their stable DNS names. For node-level concerns I ship Fluent Bit and node-exporter as DaemonSets with tolerations for the control-plane and GPU taints, a priorityClassName of system-node-critical, and updateStrategy.rollingUpdate.maxUnavailable: 10% so a bad agent image cannot blind monitoring cluster-wide.
Test. For the StatefulSet I delete kafka-1 and verify it returns with the same name, reattaches the same PVC (kubectl get pvc shows unchanged volume names) and rejoins the cluster without data loss, then run a staged image update with partition: 2 and check only ordinal 2 changes. For the DaemonSet I add a node and assert the agent Pod appears and reports within a minute, and I drain a node to ensure the DaemonSet Pod is ignored by the drain (--ignore-daemonsets).
Troubleshoot. A StatefulSet stuck creating kafka-2 is almost always the PVC: Pending because no StorageClass default exists, or the volume lives in a zone where the Pod cannot schedule (fix with WaitForFirstConsumer binding). A Pod stuck Terminating on a dead node will not be replaced automatically because identity must be unique; kubectl delete pod --force after confirming the node is really gone. DaemonSet Pods missing on some nodes trace to untolerated taints or nodeSelector labels absent on new node pools.
The key consideration is that StatefulSets give stable identity, not data replication; the application itself must handle consistency.
23Explain persistent volumes PVC storage classes in the context of Kubernetes (K8s).
Kubernetes separates storage supply from storage demand. A PersistentVolume (PV) is a cluster-scoped piece of storage (an EBS disk, an NFS export, a Ceph RBD image) with capacity, access modes and a reclaim policy. A PersistentVolumeClaim (PVC) is a namespaced request by a workload: “I need 20 GiB, ReadWriteOnce, class fast-ssd ”. The control plane binds a claim to a matching PV, and the Pod mounts the PVC by name.
A StorageClass makes PVs on demand. It names a CSI provisioner and parameters, so a PVC referencing the class triggers dynamic provisioning instead of relying on pre-created PVs.
apiVersion: storage.k8s.io/v1
kind: StorageClass
metadata: { name: fast-ssd }
provisioner: ebs.csi.aws.com
parameters: { type: gp3, iops: "6000" }
reclaimPolicy: Retain
volumeBindingMode: WaitForFirstConsumer
allowVolumeExpansion: true
Key fields and behaviours:
- Access modes:
ReadWriteOnce(one node),ReadOnlyMany,ReadWriteMany(needs a shared filesystem such as NFS/EFS),ReadWriteOncePod(one Pod, GA in 1.29). - reclaimPolicy:
Deletedestroys the backing disk when the PVC is deleted;Retainkeeps it for manual recovery. - volumeBindingMode:
WaitForFirstConsumerdelays provisioning until a Pod is scheduled so the disk is created in the Pod’s zone. - allowVolumeExpansion lets a PVC be grown by editing
spec.resources.requests.storage; shrinking is not supported.
The lifecycle is provision → bind → mount → release → reclaim, with the PV’s status.phase moving through Available, Bound, Released.
24In a real project using Kubernetes (K8s), how would you apply, test, or troubleshoot persistent volumes PVC storage classes?
Apply. For a PostgreSQL instance and a document-processing service I would define two StorageClasses: fast-ssd (gp3 or pd-ssd, Retain, WaitForFirstConsumer, expansion enabled) for the database, and shared-files backed by EFS/Filestore with ReadWriteMany for the processors that need a common scratch area. Nothing uses the cloud default class, which is usually Delete and slow. Database backups use CSI VolumeSnapshots on a CronJob plus logical dumps, because a snapshot is not a tested restore. PVC sizes are set with headroom and a Prometheus alert on kubelet_volume_stats_available_bytes under 15%.
Test. In staging I write a known dataset, delete the Pod (not the PVC), and confirm the data is there after rescheduling, then expand the PVC and check df inside the Pod reflects the new size after the filesystem resize completes. I restore a snapshot into a new PVC and start a second database from it to prove the backup path. I also delete a PVC with Retain and verify the PV moves to Released and the disk still exists.
Troubleshoot. A Pod stuck ContainerCreating with FailedAttachVolume or Multi-Attach error means the volume is still attached to a previous node, typically after an unclean node failure; the CSI controller logs and cloud console show the attachment, and detaching it or deleting the stale VolumeAttachment resolves it. Pending PVCs with WaitForFirstConsumer are normal until a Pod schedules; Pending with a provisioning error points to quota or IAM permissions on the CSI driver. Permission-denied on mount is a fsGroup or securityContext mismatch.
The important consideration is that ReadWriteOnce is per node, not per Pod; two Pods on the same node can both mount it and corrupt data unless the application locks.
25Explain scheduling affinities taints tolerations in the context of Kubernetes (K8s).
The scheduler filters nodes that can run a Pod, then scores the survivors. Several mechanisms shape that decision from two directions: Pods expressing preferences about nodes, and nodes repelling Pods.
Node affinity (spec.affinity.nodeAffinity) selects nodes by label expressions, either as a hard rule (requiredDuringSchedulingIgnoredDuringExecution) or a weighted preference (preferredDuringScheduling…). It supersedes the simpler nodeSelector. Pod affinity and anti-affinity place a Pod near or away from other Pods matching a label selector within a topologyKey (node, zone); anti-affinity across topology.kubernetes.io/zone is how replicas are spread for resilience, though topologySpreadConstraints is now the more flexible tool for even spreading.
Taints are set on nodes (key=value:effect) and repel Pods that do not carry a matching toleration:
NoSchedule– new Pods are not placed.PreferNoSchedule– avoided if possible.NoExecute– running Pods without a toleration are evicted, optionally aftertolerationSeconds.
spec:   # after: kubectl taint nodes gpu-1 accelerator=nvidia:NoSchedule
  tolerations:
    - key: accelerator
      operator: Equal
      value: nvidia
      effect: NoSchedule
  affinity:
    nodeAffinity:
      requiredDuringSchedulingIgnoredDuringExecution:
        nodeSelectorTerms:
          - matchExpressions:
              - { key: accelerator, operator: In, values: [nvidia] }
A toleration only allows a Pod onto a tainted node; it does not attract it, which is why dedicated node pools pair a taint with a node affinity. The control plane uses taints itself: node.kubernetes.io/not-ready and unreachable with NoExecute evict Pods from failed nodes after 300 seconds by default.
26In a real project using Kubernetes (K8s), how would you apply, test, or troubleshoot scheduling affinities taints tolerations?
Apply. In a cluster mixing web services, nightly ML training and a licensed database, I would create three node pools. GPU nodes carry accelerator=nvidia:NoSchedule so only training Jobs with the toleration and matching node affinity land there and expensive GPUs never fill with web Pods. The database pool is tainted workload=db:NoSchedule and labelled; the StatefulSet tolerates it and uses required node affinity plus podAntiAffinity on kubernetes.io/hostname. Web Deployments use topologySpreadConstraints with maxSkew: 1 across zones and whenUnsatisfiable: ScheduleAnyway so a zone outage does not block rollouts. Spot nodes get a PreferNoSchedule taint plus a NoExecute toleration with tolerationSeconds tuned for graceful drain on preemption.
Test. kubectl get pods -o wide after a deploy shows the node distribution; a script asserts no two replicas share a node and no non-GPU Pod sits on a GPU node. In staging I taint a node NoExecute and watch the eviction and rescheduling timeline. The scheduler’s own reasoning is checked with kubectl describe pod on a Pending Pod, which lists how many nodes failed each predicate.
Troubleshoot. 0/12 nodes are available: 4 node(s) had untolerated taint, 8 node(s) didn't match Pod's node affinity is self-explanatory once read carefully; the usual fixes are a label missing on a new node pool or a toleration with the wrong effect. Pods piling onto one node after a scale-down means anti-affinity was preferred rather than required, or the Descheduler is not running to rebalance. Hard anti-affinity with more replicas than nodes leaves Pods permanently Pending.
The consideration is that required rules are evaluated only at scheduling time (IgnoredDuringExecution); label changes later do not move Pods.
27Explain rolling updates and rollbacks in the context of Kubernetes (K8s).
A rolling update is the default Deployment strategy (strategy.type: RollingUpdate): when the Pod template changes, the Deployment controller creates a new ReplicaSet and incrementally scales it up while scaling the old one down, so some replicas are always serving. Two parameters bound the transition:
maxSurge– how many extra Pods may exist abovereplicas(default 25%).maxUnavailable– how many Pods may be missing belowreplicas(default 25%).
New Pods must pass their readiness probe before they count as available and before further old Pods are removed; minReadySeconds adds a settling delay, and progressDeadlineSeconds (default 600) marks the rollout as failed if it stalls.
A rollback is simply a rollout to a previous template. Old ReplicaSets are kept (up to revisionHistoryLimit, default 10), so kubectl rollout undo re-applies that ReplicaSet’s template and the same rolling mechanism runs in reverse.
kubectl set image deploy/checkout api=registry.example.com/checkout:1.9.0
kubectl rollout status deploy/checkout          # waits for completion
kubectl rollout history deploy/checkout
kubectl rollout undo deploy/checkout --to-revision=3
kubectl rollout pause deploy/checkout           # hold for a canary check
The flow for one update looks like this.

The alternative strategy Recreate kills all old Pods before starting new ones, acceptable only when two versions must never coexist. Blue/green and canary are not built into Deployments; they are composed from two Deployments plus Service or Gateway traffic weights, or delegated to Argo Rollouts or Flagger.
28In a real project using Kubernetes (K8s), how would you apply, test, or troubleshoot rolling updates and rollbacks?
Apply. For an API behind a Gateway I would set maxUnavailable: 0 and maxSurge: 25% so capacity never drops during a release, pair it with a readiness probe that includes dependency checks and a preStop sleep of a few seconds so the endpoint is removed before the process stops. Database migrations run as a separate Job that must be backward-compatible with the previous version, because during the rollout both versions run concurrently. Rollbacks are automated: the CD pipeline (Argo Rollouts or a Flagger canary) watches error rate and p95 latency from Prometheus for ten minutes and aborts to the stable ReplicaSet if either breaches the SLO. kubectl rollout undo stays a manual fallback with the kubernetes.io/change-cause annotation populated so history is readable.
Test. A pre-production rollout runs under synthetic load from k6 with a hard assertion of zero non-2xx responses and no connection resets; this catches missing preStop hooks and readiness that returns 200 too early. I deliberately deploy a broken image to confirm progressDeadlineSeconds marks the rollout failed, the alert fires, and the undo completes without a traffic gap. Schema compatibility between N and N-1 is tested in CI by running the old service against the migrated schema.
Troubleshoot. kubectl rollout status hanging with 1 of 3 updated replicas are available means the new Pods never become Ready; kubectl describe on one new Pod gives the probe failure or image error. If old Pods are also disappearing, maxUnavailable is non-zero and the rollout is eroding capacity. After an undo, confirm kubectl get rs shows the restored ReplicaSet at full count and that the GitOps tool is not immediately re-applying the bad version.
The important consideration is that rollback restores the Pod template only; ConfigMaps, Secrets and database schema changes made alongside are not reverted.
29Explain Helm charts in the context of Kubernetes (K8s).
Helm is the package manager for Kubernetes. A chart is a versioned bundle of templated manifests plus default values; installing a chart with specific values produces a release, a named, versioned set of resources in a namespace that Helm tracks in a Secret so it can upgrade, diff, and roll back the whole application as one unit.
A chart’s layout:
checkout/
  Chart.yaml          # name, version, appVersion, dependencies
  values.yaml         # defaults users override
  templates/
    deployment.yaml   # Go templates: {{ .Values.image.tag }}
    service.yaml
    _helpers.tpl      # named template snippets
  charts/             # dependency charts (subcharts)
Everyday commands: helm install checkout ./checkout -f prod-values.yaml, helm upgrade --install for idempotent CI, helm template to render without a cluster, helm diff upgrade (plugin) to preview, helm rollback checkout 4, and helm test to run Pods annotated as tests. Charts are shared through OCI registries (oci://registry.example.com/charts/checkout) or classic HTTP repositories.
Templates are Go text/template with Sprig functions, which makes them powerful but easy to render into invalid YAML; values.schema.json validates inputs, and helm lint catches structural mistakes. Helm 3 removed the in-cluster Tiller component, so Helm uses the caller’s kubeconfig credentials and RBAC directly. Kustomize is the main alternative: overlay patches instead of templates, no release tracking. Many teams combine them, rendering a Helm chart and post-processing with Kustomize inside Argo CD or Flux.
30In a real project using Kubernetes (K8s), how would you apply, test, or troubleshoot Helm charts?
Apply. For a platform with twenty services I would maintain one internal library chart that encodes house standards (labels, probes, security context, PodDisruptionBudget, ServiceMonitor) and have each service’s chart depend on it with a short values.yaml, so a fix to the library propagates on the next upgrade. Third-party components (ingress controller, Prometheus, cert-manager) are installed from upstream charts with pinned versions and environment-specific values files committed to Git; Argo CD or Flux performs the helm upgrade, never a laptop. Secrets never go in values files; the chart references ExternalSecrets.
Test. CI runs helm lint, helm template piped into kubeconform against the target Kubernetes version’s schemas, and helm-unittest snapshot tests that assert rendered output for key value combinations (TLS on/off, HPA enabled). Charts are then installed into a kind cluster with --wait --timeout 5m and helm test executes a smoke Pod. Every pull request shows a helm diff of what production would change.
Troubleshoot. helm upgrade failing with “another operation is in progress” is a release left in pending-upgrade after an interrupted run; helm history shows it and helm rollback to the last deployed revision clears it. Rendering errors like nil pointer evaluating interface mean a value path assumed in a template is unset for this environment; helm template --debug pinpoints it. Resources “already exist” errors come from objects created outside Helm, fixed by adopting them with meta.helm.sh/release-name annotations. A release that reports success but runs old Pods usually has an image tag that did not change.
The consideration is that helm rollback restores manifests, not CRD schemas, PVC contents or hooks’ side effects.
31Explain network policies in the context of Kubernetes (K8s).
By default every Pod can reach every other Pod in the cluster. A NetworkPolicy (networking.k8s.io/v1) is a namespaced firewall rule set that selects Pods by label and whitelists the ingress and/or egress traffic allowed to them. As soon as any policy selects a Pod for a direction, all traffic in that direction not explicitly allowed is dropped; multiple policies are additive.
Peers can be specified three ways, combinable with ports:
podSelector– Pods in the same namespace.namespaceSelector– all Pods in namespaces with given labels (combine withpodSelectorin one item for “these Pods in those namespaces”).ipBlock– CIDR ranges, mainly for external endpoints.
apiVersion: networking.k8s.io/v1
kind: NetworkPolicy
metadata: { name: orders-db-ingress, namespace: shop }
spec:
  podSelector: { matchLabels: { app: orders-db } }
  policyTypes: [Ingress]
  ingress:
    - from:
        - podSelector: { matchLabels: { app: orders-api } }
      ports:
        - { protocol: TCP, port: 5432 }
This allows only orders-api Pods to reach the database on 5432; everything else is denied. The default-deny pattern is an empty podSelector: {} with policyTypes: [Ingress, Egress] and no rules, after which each application adds its allow-list. Egress deny must still permit DNS to kube-system on UDP/TCP 53.
Enforcement is done by the CNI plugin, not by Kubernetes itself; Calico, Cilium and most managed CNIs support it, but a cluster with a CNI lacking support silently accepts the object and enforces nothing. Vendor CRDs (CiliumNetworkPolicy, Calico GlobalNetworkPolicy) add L7 rules, FQDN egress and cluster-wide scope that the core API does not offer.
32In a real project using Kubernetes (K8s), how would you apply, test, or troubleshoot network policies?
Apply. In a PCI-scoped payments namespace I would start from default-deny for both directions, then write one policy per workload: the API accepts ingress only from the Gateway namespace (namespaceSelector on a gateway.networking.k8s.io/gateway-name label or a fixed role=ingress label), the database accepts only the API on 5432, and egress allows DNS, the payment provider’s CIDR on 443, and the observability namespace. Policies live in the same Helm chart as the workload so they evolve together. Namespaces get the default-deny policy at creation via the platform’s namespace provisioner, so a new team cannot forget it.
Test. CI deploys the chart into kind with Cilium and runs a connectivity matrix: a netshoot Pod in various namespaces attempts nc -zv to each target, asserting expected allows and denies; cilium connectivity test or Calico’s policy preview tools do the same at larger scale. Audit mode (Cilium’s policy-verdict logs, Calico log action) runs in staging for a week before enforcing to catch flows nobody documented.
Troubleshoot. The symptom is always a timeout, never a refusal, because dropped packets produce no RST. First confirm a policy actually selects the Pod (kubectl describe netpol, check label spelling) and that the CNI enforces policies at all. Then check the peer side: egress on the client and ingress on the server must both allow the flow. Forgotten DNS egress makes everything look broken at once. Cilium’s Hubble (hubble observe --verdict DROPPED) or Calico flow logs show exactly which policy dropped a packet.
The common mistake is relying on ipBlock for Pod IPs, which change constantly; use selectors for anything inside the cluster.
33Explain DNS and service discovery in the context of Kubernetes (K8s).
Service discovery in Kubernetes is DNS-based and provided by CoreDNS, which runs as a Deployment in kube-system behind the kube-dns ClusterIP Service. The kubelet writes that address into every Pod’s /etc/resolv.conf (for the default dnsPolicy: ClusterFirst) along with search domains and ndots:5.
Records CoreDNS serves:
<service>.<namespace>.svc.cluster.local→ the ClusterIP (A/AAAA record).- Headless Service → one A record per ready Pod IP; for StatefulSets also
<pod>.<service>.<namespace>.svc.cluster.local. _<port>._<proto>.<service>.<namespace>.svc.cluster.local→ SRV records with the port number.- Pods themselves normally have no records;
hostname/subdomainfields can create them.
The search path lets a Pod in namespace shop call inventory, inventory.shop or the fully qualified name. Because of ndots:5, a name with fewer than five dots is first tried with each search suffix, so an external lookup such as api.stripe.com generates several failing queries before the absolute one; appending a trailing dot or lowering ndots via dnsConfig avoids that.
$ kubectl exec -it debug -- nslookup inventory.shop
Server:    10.96.0.10
Name:      inventory.shop.svc.cluster.local
Address:   10.96.112.44
Beyond DNS, Kubernetes also injects INVENTORY_SERVICE_HOST -style environment variables for Services that existed when the Pod started, which is legacy and unreliable for ordering. NodeLocal DNSCache runs a caching agent per node to cut latency and CoreDNS load. External names resolve through CoreDNS forwarding to the node’s upstream resolvers, and ExternalName Services alias external hosts into the cluster namespace.
34In a real project using Kubernetes (K8s), how would you apply, test, or troubleshoot DNS and service discovery?
Apply. Services in an order platform address each other by <service>.<namespace> and never by ClusterIP, with the namespace always included so a chart deployed into a different namespace still resolves correctly. For high-QPS clusters I deploy NodeLocal DNSCache, scale CoreDNS with the cluster-proportional autoscaler, and set dnsConfig.options: [{name: ndots, value: "2"}] on Pods that make many external calls. Cross-cluster or external discovery uses ExternalDNS to publish Gateway addresses into Route 53 and ExternalName Services for third-party endpoints so a vendor change is a one-line Service edit.
Test. A conformance test Pod resolves a ClusterIP Service, a headless StatefulSet Pod record, an SRV record and an external domain, asserting answers and latency. Load tests include a DNS QPS panel from CoreDNS metrics (coredns_dns_request_duration_seconds, coredns_dns_responses_total{rcode="SERVFAIL"}) because DNS is the first thing to saturate during autoscaling bursts. I also verify applications respect the record TTL rather than caching a Pod IP forever (notably older JVMs).
Troubleshoot. NXDOMAIN for an internal name is a namespace or typo issue; kubectl get svc -A | grep confirms. Intermittent 5-second timeouts under load are the classic conntrack race with UDP in some kernels; mitigations are NodeLocal DNSCache, single-request-reopen in dnsConfig, or forcing TCP. A Pod with dnsPolicy: Default or hostNetwork: true without ClusterFirstWithHostNet uses the node resolver and cannot see cluster names. kubectl logs -n kube-system -l k8s-app=kube-dns with the log plugin enabled shows the actual queries.
The important consideration is that DNS returns one address per Service and does no HTTP-level balancing; long-lived connections still need client or proxy-side balancing.
35Explain etcd and control-plane reliability in the context of Kubernetes (K8s).
etcd is the strongly consistent, Raft-based key-value store that holds every object in the cluster; the API server is its only client. Writes go through the Raft leader and are committed once a majority of members have persisted them, so the cluster needs quorum: floor(n/2) + 1 members. Three members tolerate one failure, five tolerate two; even counts add cost without extra fault tolerance. Losing quorum makes etcd read-only (and in practice the cluster frozen: existing Pods keep running, but nothing can be scheduled or changed).
Reliability of the control plane therefore means:
- Topology – three or five control-plane nodes spread across zones, either stacked (etcd co-located with the API server on each node) or external (a dedicated etcd cluster), with a load balancer in front of the API servers, which are stateless and horizontally scalable.
- Disk latency – etcd fsyncs every write;
wal_fsync_duration_secondsp99 should stay under 10 ms, which rules out network disks without provisioned IOPS. - Database size – the default 2 GiB quota (
--quota-backend-bytes, max 8 GiB) triggers aNOSPACEalarm when exceeded; regular compaction and defragmentation keep it healthy. - Backups –
etcdctl snapshot saveon a schedule, stored off-cluster, plus a tested restore procedure. - Encryption – Secrets encrypted at rest through the API server’s
EncryptionConfiguration, and TLS on peer and client ports.
This topology shows a three-node stacked control plane.
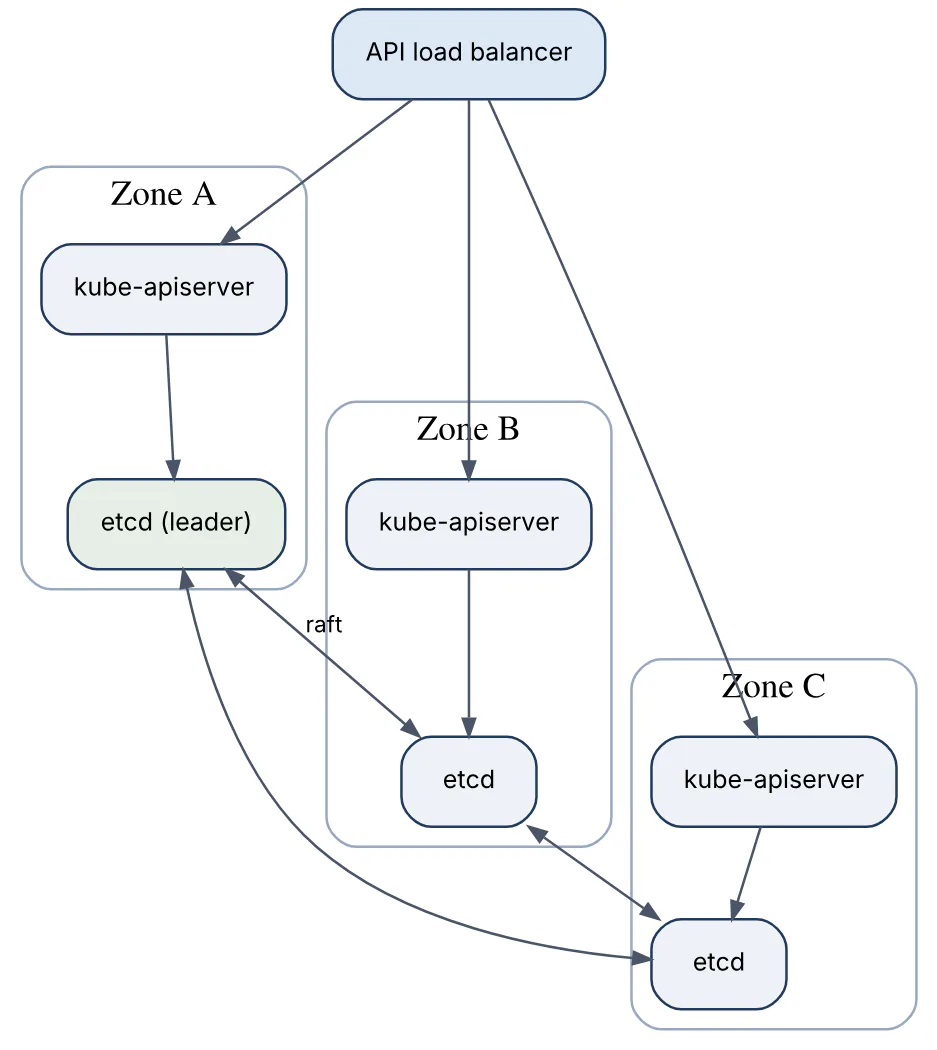
Managed services run this for you, but the quota, object churn and watch load you generate still determine how healthy it is.
36In a real project using Kubernetes (K8s), how would you apply, test, or troubleshoot etcd and control-plane reliability?
Apply. For an on-prem cluster running a trading back office I would deploy three control-plane nodes in separate racks with stacked etcd on local NVMe, a keepalived/HAProxy virtual IP for the API endpoint, and automatic hourly etcdctl snapshot save to object storage with 30-day retention. Scheduled etcdctl defrag runs on one member at a time during a maintenance window. Workloads that churn objects (operators creating thousands of short-lived CRs, Jobs without ttlSecondsAfterFinished) are reviewed because they are the usual cause of etcd growth. Alerting covers quorum loss, leader changes per hour, fsync latency, database size against quota, and API server 5xx rate.
Test. Quarterly game days: stop one etcd member and confirm the cluster stays writable; stop two and confirm it goes read-only but running Pods are unaffected; then restore a snapshot into a fresh control plane in a lab and verify objects and Secrets decrypt correctly. etcdctl check perf and fio fsync benchmarks run on new hardware before it joins. API performance is load-tested with kube-burner to see where apiserver_request_duration_seconds degrades.
Troubleshoot. kubectl hanging while Pods still serve traffic is the signature of lost quorum or an etcd leader election storm; etcdctl endpoint status --cluster shows member health, leader and DB size, and etcd_disk_wal_fsync_duration_seconds climbing identifies a slow disk. etcdserver: mvcc: database space exceeded requires compaction, defrag and alarm disarm. A member that fell behind and refuses to rejoin is removed and re-added as a new member rather than repaired.
The consideration is that etcd restores reset the cluster’s state in time; anything created after the snapshot, including Pod IPs and leases, must be reconciled by controllers afterwards.
37Explain cluster upgrades in the context of Kubernetes (K8s).
Upgrading a cluster means moving the control plane and then the nodes to a new Kubernetes minor version while workloads keep running, within the project’s version skew policy:
- Kubernetes ships three minor releases a year, each supported for about 14 months, so staying within supported versions requires at least one upgrade a year.
- Upgrades go one minor version at a time (1.31 → 1.32 → 1.33); skipping is unsupported.
kube-apiserverinstances may differ by one minor during the upgrade; the kubelet may be up to three minors older than the API server (since 1.28) but never newer;kubectlworks within one minor either way.
The sequence is always the same:
- Read the changelog for removed APIs (e.g.
PodSecurityPolicyin 1.25,FlowSchema v1beta2in 1.29) and feature-gate changes;kubectl api-resources,plutoorkubentdetect manifests using soon-to-be-removed versions. - Back up etcd.
- Upgrade the control plane, one node at a time for self-managed clusters (
kubeadm upgrade apply), or trigger the managed provider’s control-plane upgrade. - Upgrade add-ons that track the version: CoreDNS, kube-proxy, CNI, CSI drivers, metrics-server.
- Upgrade nodes: either in place with
kubeadm upgrade nodeafterkubectl drain, or, preferably, by rolling in fresh nodes with the new kubelet (surge upgrade) and draining the old ones. - Run conformance and application smoke tests; only then upgrade the next environment.
Managed services (EKS, GKE, AKS) automate steps 3–5 with configurable surge and maintenance windows, but the API deprecation review, PodDisruptionBudgets and add-on compatibility remain the operator’s responsibility. Draining depends on PDBs: a workload with a PDB that can never be satisfied blocks the node upgrade indefinitely.
38In a real project using Kubernetes (K8s), how would you apply, test, or troubleshoot cluster upgrades?
Apply. For EKS clusters serving a retail platform, upgrades run quarterly through a pipeline: dev first, staging after a week of soak, production in a maintenance window. The pipeline runs pluto detect-all-in-cluster and kubent, fails on any deprecated API in use, bumps the control plane in Terraform, then upgrades add-ons (VPC CNI, CoreDNS, kube-proxy, EBS CSI) to the versions published for the target release, and finally rolls managed node groups with maxUnavailablePercentage: 25 and a surge so capacity holds. Every workload already has a PodDisruptionBudget and at least two replicas, and the autoscaler’s --skip-nodes-with-local-storage=false is set so nodes with emptyDir volumes still drain.
Test. Before production I run the application’s end-to-end suite and Sonobuoy conformance against the upgraded staging cluster, plus a chaos step that drains a node mid-traffic to confirm PDBs and probes keep error rate at zero. Helm charts for third-party controllers are tested against the new version in kind in CI weeks earlier using the exact node image.
Troubleshoot. A node group upgrade that stalls almost always traces to a drain blocked by a PDB (kubectl get pdb shows ALLOWED DISRUPTIONS 0) or a Pod with a long terminationGracePeriodSeconds; the fix is scaling the workload or relaxing the budget, not force-deleting. Workloads failing after the upgrade with no matches for kind are using a removed API version. Webhook-based admission controllers compiled against an old client can reject every request after an upgrade, so I keep their failurePolicy: Ignore for the window or upgrade them first.
The important consideration is that a control plane cannot be downgraded; rollback means restoring etcd from the pre-upgrade snapshot, which loses everything created since.
39Explain container image pull errors in the context of Kubernetes (K8s).
When the kubelet asks the container runtime to fetch an image and the fetch fails, the Pod stays in a waiting state with reason ErrImagePull, then ImagePullBackOff as the kubelet retries with exponential backoff (capped at five minutes). The Pod is scheduled and has a node, but no container ever starts. kubectl describe pod shows the exact reason in the Events section; the common causes are:
- Wrong name or tag – typo, a tag that was never pushed, or an image promoted to the wrong repository; the registry answers
manifest unknown/not found. - Authentication – the registry is private and the Pod has no matching
imagePullSecrets, or the stored credential expired (unauthorized/401). Node-level credentials via the kubelet credential provider (ECR, GCR, ACR) remove the need for per-Pod secrets on managed clusters. - Network – egress blocked by a firewall or NetworkPolicy, a proxy not configured on the node, or a registry outage (
i/o timeout,TLS handshake timeout). - Rate limits – Docker Hub’s anonymous pull limit yields
toomanyrequests. - Architecture mismatch – an amd64-only image on an arm64 node pulls but fails to run, or fails with
no match for platform. - Policy – an admission controller or the runtime rejecting unsigned images or images outside an allow-list.
kubectl describe pod checkout-7c9d-x2k1 | grep -A5 Events
  # Failed to pull image "registry.example.com/checkout:1.9.0":
  #   rpc error: ... unauthorized: authentication required
kubectl create secret docker-registry regcred \
  --docker-server=registry.example.com --docker-username=ci \
  --docker-password="$TOKEN" -n shop
The imagePullPolicy also matters: Always (the default for latest or untagged images) contacts the registry on every Pod start, so a registry outage can stop otherwise-cached images from running; IfNotPresent uses the node cache when the image is already present.
40In a real project using Kubernetes (K8s), how would you apply, test, or troubleshoot container image pull errors?
Apply. The goal is to make pull errors rare and loud. Images for a payments platform are built once in CI, pushed to a private registry (ECR) under an immutable semantic tag and referenced in manifests by digest, so a Deployment can never point at an unpublished tag. Nodes authenticate through the kubelet credential provider or instance IAM rather than imagePullSecrets copied into every namespace. A pull-through cache or mirror in front of Docker Hub removes rate limits and third-party outages from the critical path, and multi-arch manifests are built with docker buildx because the cluster mixes Graviton and x86 nodes. imagePullPolicy: IfNotPresent with pinned tags lets Pods restart during a registry outage.
Test. CI includes a step that pulls the exact image reference from a runner using only the credentials the cluster will have, and kubectl apply --dry-run=server plus a Kyverno verifyImages rule confirms signatures and the allowed registry list before anything reaches production. Deploys wait on kubectl rollout status with a timeout so an ImagePullBackOff fails the pipeline instead of lingering.
Troubleshoot. kubectl describe pod gives the registry’s message verbatim: not found means the tag is wrong or not yet promoted (check the registry UI and the build logs); unauthorized means credentials, so I inspect the Secret with kubectl get secret regcred -o jsonpath='{.data. \.dockerconfigjson}' | base64 -d and verify the server hostname matches exactly; timeouts send me to node egress, proxies and NetworkPolicies, confirmed by crictl pull on the node itself. A sudden cluster-wide wave of pull failures with no deploy is a registry or token-expiry event, not an application bug.
The common mistake is a mutable latest tag with Always, which silently deploys whatever was pushed most recently and makes incidents unreproducible.
41Explain CrashLoopBackOff troubleshooting in the context of Kubernetes (K8s).
CrashLoopBackOff is not an error in itself; it is the kubelet’s status for a container that keeps exiting and is being restarted with increasing delay (10 s, 20 s, 40 s… capped at 5 minutes, reset after the container runs cleanly for 10 minutes). The Pod’s restartPolicy is Always or OnFailure, the process dies, and Kubernetes is doing exactly what it was told. Troubleshooting means finding out why the process exits.
The loop looks like this.
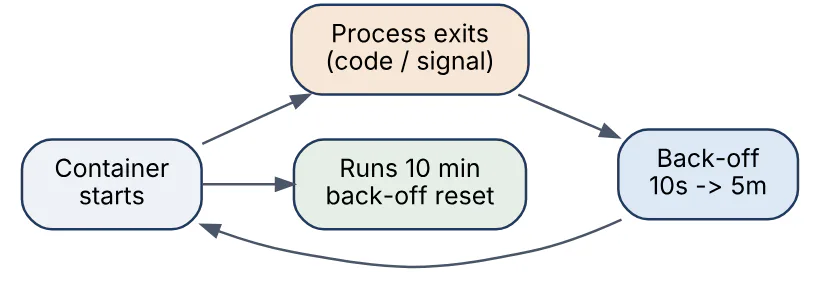
The diagnostic sequence:
kubectl describe pod– look atLast State, the exit code and reason.137isOOMKilledor SIGKILL (memory limit or liveness probe),143is SIGTERM,1is an application error,126/127is a bad command or missing binary.kubectl logs <pod> --previous– the output of the crashed container, not the one currently starting.- Check events for
Liveness probe failed,CreateContainerConfigError, or volume mount failures preceding the crash. - If the container dies too fast to inspect, override the command (
command: ["sleep", "3600"]) or usekubectl debugwith an ephemeral container to look inside.
Typical root causes: a missing environment variable or ConfigMap key, an unreachable dependency the app treats as fatal at startup, wrong entrypoint, a memory limit below the application’s working set, a liveness probe that fails before the app is ready (fixed with a startup probe), or file permission errors under a non-root securityContext.
42In a real project using Kubernetes (K8s), how would you apply, test, or troubleshoot CrashLoopBackOff troubleshooting?
Apply. In a team running fifty microservices I would turn the diagnostic steps into standard tooling: every container logs its startup configuration (minus secrets) and the exact reason before exiting non-zero; a startup probe exists wherever boot time exceeds a few seconds; memory limits derive from VPA recommendations rather than guesses; and dependencies are retried with backoff in the application rather than crashing on first failure. A runbook links an alert on kube_pod_container_status_waiting_reason{reason="CrashLoopBackOff"} firing for more than five minutes to a dashboard that shows the exit code, last log lines and recent deploys for that Pod.
Test. Every service’s CI runs the container with an intentionally wrong configuration and asserts it exits within two seconds with a readable message and non-zero code; a service that hangs or exits 0 fails the build. In staging I inject a dependency outage with a NetworkPolicy to verify the app degrades rather than crashes, and I lower the memory limit until it OOM-kills to document the real floor. Rollouts in CD wait on rollout status, so a crashing release never reaches full replicas.
Troubleshoot. The real-world sequence: alert fires, kubectl get pods shows restarts climbing, kubectl logs --previous shows connection refused to Redis, kubectl get endpoints redis shows none, root cause is a Redis rollout stuck on a PVC. When logs are empty the exit code decides: 137 with OOMKilled sends me to memory limits and JVM flags; 137 without it is a liveness probe killing a slow starter. Exit 1 right after Started container with nothing logged often means the entrypoint script fails on a shell incompatibility in a distroless image.
The important consideration is that a kubectl rollout undo stops the bleeding first; root-causing happens on the preserved crashing Pod in staging, not while production burns.
43Explain observability logs metrics tracing in the context of Kubernetes (K8s).
Observability in Kubernetes rests on three signals, each collected differently because Pods are ephemeral and nodes are interchangeable.
Logs. Containers write to stdout/stderr; the runtime stores them on the node under /var/log/pods, where kubectl logs reads them. They vanish with the node, so a DaemonSet agent (Fluent Bit, Vector, Promtail, the OpenTelemetry Collector) tails the files, enriches them with Pod, namespace and label metadata from the API, and ships them to Loki, Elasticsearch or a cloud log service. Structured JSON logs make that enrichment and later querying reliable.
Metrics. Kubernetes components and the kubelet (via cAdvisor) expose Prometheus-format metrics; kube-state-metrics turns object state (Deployment replicas, Pod phases, PDB status) into metrics; Metrics Server serves the lightweight resource metrics that kubectl top and HPA use. Prometheus (often via the Prometheus Operator and ServiceMonitor / PodMonitor CRDs) scrapes applications discovered through the API, and Grafana or Alertmanager sit on top.
Tracing. Distributed traces follow a request across services with a propagated context (W3C traceparent). Applications are instrumented with OpenTelemetry SDKs or auto-instrumentation, export spans to an OpenTelemetry Collector, which forwards to Jaeger, Tempo or a vendor. Service meshes and eBPF tools (Cilium, Pixie) can produce traces without code changes, at lower fidelity.
This is the usual collection pipeline.
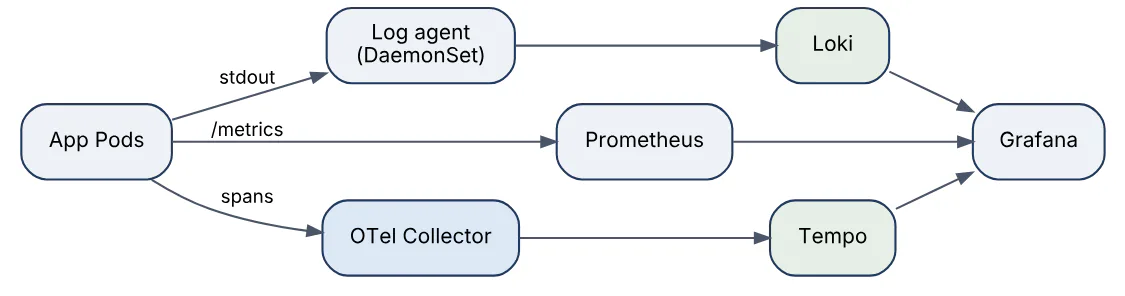
The three signals are joined by shared labels (namespace, pod, trace ID in log lines), which is what turns a latency alert into a specific failing span and its log lines.
44In a real project using Kubernetes (K8s), how would you apply, test, or troubleshoot observability logs metrics tracing?
Apply. For an order platform I would standardise on OpenTelemetry: every service emits JSON logs with trace_id, exposes /metrics with RED metrics (rate, errors, duration) per endpoint, and exports spans over OTLP to a Collector Deployment that batches, samples (tail-based, keeping all errors and slow traces) and forwards to Tempo. Fluent Bit as a DaemonSet ships logs to Loki with the Kubernetes filter adding labels; Prometheus Operator scrapes via ServiceMonitors shipped in each Helm chart; kube-state-metrics and node-exporter cover the cluster itself. Alerts are SLO-based (burn rate on availability and latency) rather than per-Pod CPU, and retention is tiered: metrics 30 days, logs 14, traces 7.
Test. A synthetic order request carrying a known trace ID is run after every deploy; the test asserts the trace appears with spans from every hop, the correlated log lines are queryable in Loki within 30 seconds, and the request counter incremented. Alert rules are unit-tested with promtool test rules, and a monthly game day kills a Pod and checks the on-call page arrives with the correct runbook link. Collector backpressure is tested by stopping Loki and confirming agents buffer to disk rather than dropping.
Troubleshoot. Missing metrics usually mean the ServiceMonitor label selector does not match the Service or the port name is wrong; the Prometheus /targets page shows the scrape error. Logs missing for one namespace point to Fluent Bit’s buffer limits or a parser failing on a malformed line (its own metrics expose fluentbit_output_retries_failed_total). Broken traces with isolated spans mean a hop drops the traceparent header, commonly an ingress proxy or an async queue without context propagation.
The important consideration is cardinality: a label such as user_id or order_id on a metric will take Prometheus down long before the application does.
45Explain jobs cronjobs in the context of Kubernetes (K8s).
A Job runs Pods until a specified number of them terminate successfully, then stops; unlike a Deployment it is for work that finishes. Failed Pods are retried up to backoffLimit (default 6) with exponential delay. Key fields:
completions– how many successful Pods are needed (default 1);parallelism– how many run at once.completionMode: Indexed– gives each Pod aJOB_COMPLETION_INDEXso a batch can be partitioned deterministically.activeDeadlineSeconds– kills the whole Job after a wall-clock limit.ttlSecondsAfterFinished– deletes the finished Job and its Pods automatically, which is essential to stop them accumulating in etcd.podFailurePolicy(GA in 1.31) – treat specific exit codes as non-retryable or ignore disruptions such as preemption.
A CronJob creates Jobs on a schedule written in standard cron syntax, evaluated in the control plane’s timezone unless timeZone (GA in 1.27) is set. concurrencyPolicy (Allow, Forbid, Replace) decides what happens when the previous run is still going; startingDeadlineSeconds limits how late a missed run may start; successfulJobsHistoryLimit / failedJobsHistoryLimit control retention.
apiVersion: batch/v1
kind: CronJob
metadata: { name: nightly-report }
spec:
  schedule: "30 1 * * *"
  timeZone: "Europe/Berlin"
  concurrencyPolicy: Forbid
  jobTemplate:
    spec:
      backoffLimit: 2
      ttlSecondsAfterFinished: 86400
      template:
        spec:
          restartPolicy: OnFailure
          containers:
            - name: report
              image: registry.example.com/reporting:2.4.0
              args: ["--date", "yesterday"]
The ownership chain is CronJob → Job → Pod, so kubectl get jobs -l on the CronJob’s labels lists history. Pod restartPolicy inside a Job must be OnFailure or Never; with Never, each failure creates a new Pod, which is better for log retention.
46In a real project using Kubernetes (K8s), how would you apply, test, or troubleshoot jobs cronjobs?
Apply. In a billing system I would run the nightly invoice generation as a CronJob with concurrencyPolicy: Forbid, startingDeadlineSeconds: 3600 and timeZone set to the finance team’s zone, and the monthly statement export as an Indexed Job with parallelism: 10 where each index processes one shard of customers. Every Job carries ttlSecondsAfterFinished, activeDeadlineSeconds, resource requests and a podFailurePolicy that stops retrying on exit code 2 (bad input) but tolerates node preemption. The task itself is idempotent, keyed by business date, because Kubernetes guarantees at-least-once, not exactly-once, execution. Database migrations are Jobs with Helm pre-upgrade hooks or an Argo CD sync wave.
Test. kubectl create job --from=cronjob/nightly-report manual-run triggers an ad-hoc run in staging to validate the template without waiting for the schedule. A test asserts a second manual run for the same date is a no-op (idempotency), and the exit-code behaviour is confirmed by running with a bad argument and checking kubectl get job -o yaml shows FailureTarget with the right reason. For CronJobs I verify the schedule by reading status.lastScheduleTime over several days in staging, including a DST transition.
Troubleshoot. A CronJob that never runs usually has an invalid schedule string, is suspend: true, or missed more than 100 scheduled times (the controller then logs too many missed start times and gives up until the deadline resets). A Job stuck Active with a Pod in Pending is a scheduling or quota problem; one that reaches backoffLimit quickly has a Pod dying before the real work starts, so kubectl logs job/<name> tells the story. Hundreds of Completed Pods clogging a namespace mean somebody omitted the TTL.
The important consideration is that a long-running Job is still killed during node drains; use a PodDisruptionBudget only if it can tolerate waiting, otherwise checkpoint progress.
47Explain pod disruption budgets in the context of Kubernetes (K8s).
A PodDisruptionBudget (policy/v1) tells Kubernetes how many Pods of an application may be unavailable at once during voluntary disruptions: node drains for upgrades, cluster autoscaler scale-down, kubectl drain, and Karpenter consolidation. All of these go through the Eviction API, which refuses an eviction that would violate a budget and returns 429 Too Many Requests until the budget allows it.
apiVersion: policy/v1
kind: PodDisruptionBudget
metadata: { name: checkout }
spec:
  minAvailable: 2          # or maxUnavailable: 1 / "25%"
  selector: { matchLabels: { app: checkout } }
Rules of the mechanism:
minAvailableormaxUnavailable, as an integer or percentage, never both; percentages are computed against the controller’s desired replicas.- Only one PDB should select a given Pod; overlapping budgets make eviction fail.
- A PDB does nothing for involuntary disruptions: node crashes, OOM kills, Pod deletion, or a Deployment rollout, which uses its own
maxUnavailable. unhealthyPodEvictionPolicy: AlwaysAllow(GA in 1.31) lets never-ready Pods be evicted so a broken application cannot block a drain forever.
This shows how a drain interacts with the budget.

A PDB with minAvailable equal to the replica count, or maxUnavailable: 0, blocks every voluntary disruption and will stall cluster upgrades; it should be used only deliberately and temporarily.
48In a real project using Kubernetes (K8s), how would you apply, test, or troubleshoot pod disruption budgets?
Apply. The platform Helm library chart in a retail company emits a PDB for every Deployment and StatefulSet by default: maxUnavailable: 1 for anything with three or more replicas, minAvailable: 1 for two-replica services, and nothing for single-replica dev workloads, since a PDB there would just block drains. Quorum systems (etcd, Kafka, ZooKeeper) get maxUnavailable: 1 so a drain can never take two members. unhealthyPodEvictionPolicy: AlwaysAllow is set so crash-looping Pods do not freeze node maintenance. Because PDBs only work if replacement Pods can actually land, they are paired with topologySpreadConstraints and enough spare capacity for the autoscaler’s surge nodes.
Test. In staging a scripted kubectl drain --ignore-daemonsets --delete-emptydir-data runs across all nodes sequentially while a load test watches error rate; the assertion is zero failed requests and the drain finishing within a time budget. kubectl get pdb before and after shows ALLOWED DISRUPTIONS returning to its expected value. A policy test rejects charts whose PDB would be unsatisfiable (minAvailable >= replicas) or whose selector matches no Pods.
Troubleshoot. A node upgrade hanging with Cannot evict pod as it would violate the pod's disruption budget is the classic case. kubectl get pdb -A with ALLOWED DISRUPTIONS 0 identifies the culprit; usual causes are a one-replica Deployment with minAvailable: 1, Pods that are not Ready so the budget is already breached, or two PDBs overlapping. The fix is scaling up temporarily or correcting the budget, not --disable-eviction. Autoscaler scale-down that never happens is often the same budget silently refusing evictions, visible in the cluster-autoscaler logs.
The key consideration is that a PDB protects availability during maintenance but it also transfers responsibility: the application must truly serve correctly with minAvailable replicas.
49Explain security admission and policies in the context of Kubernetes (K8s).
After a request is authenticated and authorised, it passes through admission control, the last gate before an object is persisted. Mutating admission runs first (defaults, sidecar injection), then schema validation, then validating admission; any validating admission controller can reject the request. This is where cluster security policy is enforced, because RBAC says who can create a Pod but not what that Pod may contain.

The main mechanisms:
- Pod Security Admission (built in, GA since 1.25) applies the Pod Security Standards (
privileged,baseline,restricted) per namespace via labels such aspod-security.kubernetes.io/enforce: restricted, with separateauditandwarnmodes. It replaced PodSecurityPolicy. - ValidatingAdmissionPolicy (GA in 1.30) and MutatingAdmissionPolicy (beta in 1.34) express rules in CEL inside the API server, no webhook needed: for example, deny any container without resource limits or any image not from the corporate registry.
- Admission webhooks call external policy engines: Kyverno (YAML policies, can mutate, generate and verify image signatures) or OPA Gatekeeper (Rego constraints). They are more expressive but add latency and an availability dependency, controlled by
failurePolicy. - Related controls:
securityContextfields (runAsNonRoot,readOnlyRootFilesystem, dropped capabilities, seccomp profiles), image signature verification with Sigstore/cosign, and runtime detection with Falco or Tetragon.
apiVersion: v1
kind: Namespace
metadata:
  name: payments
  labels:
    pod-security.kubernetes.io/enforce: restricted
    pod-security.kubernetes.io/warn: restricted
Policy should be layered: Pod Security Admission for the baseline, CEL policies for cheap deterministic rules, and a webhook engine only where mutation or external data is required.
50In a real project using Kubernetes (K8s), how would you apply, test, or troubleshoot security admission and policies?
Apply. For a regulated fintech platform I would label every application namespace enforce: restricted and kube-system -style platform namespaces baseline, with audit / warn set one level stricter than enforce so teams see upcoming requirements. On top, ValidatingAdmissionPolicy objects reject Pods without requests and limits, Ingress/HTTPRoute objects using wildcard hosts, and images outside registry.example.com. Kyverno handles what CEL cannot: injecting default securityContext and topologySpreadConstraints, generating default-deny NetworkPolicies for new namespaces, and verifying cosign signatures from the CI pipeline’s key. All policies are versioned in Git and deployed by Argo CD before workloads.
Test. Policies are unit-tested with the Kyverno CLI (kyverno test) using fixture manifests that must pass and must fail; CEL policies are exercised with kubectl apply --dry-run=server on the same fixtures in a kind cluster during CI. New policies roll out in Audit mode first; a Prometheus query on apiserver_admission_webhook_rejection_count and the audit log confirms zero unintended hits before switching to Enforce. A conformance-style test deploys a deliberately privileged Pod and asserts rejection.
Troubleshoot. A rejected Deployment shows nothing wrong in kubectl get deploy; the error surfaces in the ReplicaSet’s events (kubectl describe rs) as violates PodSecurity "restricted" or the webhook’s message, so that is the first place to look. Webhook timeouts (context deadline exceeded) point to the policy engine being down or unreachable through a NetworkPolicy; with failurePolicy: Fail that blocks all matching requests, including the engine’s own redeploy, which is why the engine runs with multiple replicas and a PDB. Policies that suddenly match too much are usually a selector missing a namespace exclusion.
The important consideration is that admission only evaluates new or updated objects; existing non-compliant workloads remain until a background scan (Kyverno reports, Gatekeeper audit) finds them.
Answers tailored to your resume and job description
Add your resume and the job description in CrackItX's Settings. When the interviewer asks a Kubernetes (K8s) question, Claude suggests an answer using your real projects and the role's requirements, in real time.
See pricing →